Task 1
Discuss the K-means Clustering Algorithm
Introduction
The K-means clustering algorithm is one of the most used methods of unsupervised learning for the partition of data into k clusters. Laying out to reduce the internal variation within clusters and affecting the maximum inter variation between clusters, the algorithm forms an important tool for data analysis and learning. In a way, K-means clustering (Ghazal et al.,2021) helps find more qualitative relations between values by sorting similar data points.
Working Principles
K-means clustering algorithm is systematic in nature (Ikotun et al.,2021) and primary iterations process presents a closer view of the algorithm. It starts with presumed number of clusters that has to be identified or determined and is represented by ‘k’. The steps involved in the algorithm are as follows:
- Initialization of Centroids:
Choose at random k data points as initial centroids (Kleindessner et al.,2019). These centroids serve as the beginning points of the positioning the centers of clusters.
- Assignment Step:
First, assign every data point from the dataset to that cluster the closest centroid is to it. In most cases it is computed literally as distance, Euclidean distance, yet Manhattan distance or cosine similarities (Wang et al.,2021) could be used as well depending at the task at hand.
- Update Step:
Renormalize by finding the center of mass of all the points currently belonging to that cluster. These new centroids are the new centers of their different clusters.
- Convergence Check:
Perform another cycle of assignment, updating the steps until the centroids remain steady whereby little or no change exists between the two. On the other hand, after a fixed number of iterations or after the variance reduction between within clusters reaches a certain limit, the algorithm stops.
Advantages
There are many advantages associated with K-means clustering as follows which shows it several benefits that would make its application preferable for many proposes.
- Computational Efficiency:
The algorithm is computationally efficient in terms of big ‘O’ notation (Gmys et al.,2020) and it is also faster when dealing large amounts of data, the time tuned is proportional to the number of data points and clusters with ‘O(n) complexity.
- Simplicity:
Algorithm is simple to use and anybody with a basic knowledge of machine learning can use it.
- Scalability:
K-means is rather effective with large data sets of courses (Tang et al.,2019), and it even works effectively in case if the data is high-dimensional and PCA is used as a pre-processing step.
- Versatility:
Some simply require distance metrics to be modified and some more may require change in the pre-processing techniques and so, it can be applied in various fields like marketing, healthcare and natural language processing etc.
Disadvantages
Although K- means is powerful its has some built in drawbacks that need to be taken into consideration.
- Predefined Number of Clusters:
Since k means needs to be defined in advance this becomes a major issue whenever the best value for k is unknown (Liu et al.,2019). There is no perfect method of estimating k as it can be done using the elbow method or through silhouette analysis.
- Sensitivity to Initialization:
Its last cluster consequence presupposes high sensitiveness to the initial choice of centers. Lack of efficient initialization may make the solution average, and hence different techniques like K-means++ to improve centroids’ selection are used.
- Assumption of Spherical Clusters:
In many cases in real life, such assumptions may not hold as K-means assumes that clusters are spherical, and of nearly equal size.
- Impact of Outliers:
Centroid computation was sensitive to outliers and noisy data points, and these problems could result in distorted clusters (Alam et al.,2020). The convergence is cited to be to local optimum as opposed to the global optimum where initial position of centroids is a key to this.
Real-World Applications
K-means clustering is commonly applied in numerous industries and within many disciplines because of the efficiency of finding similar objects (Miraftabzadeh et al.,2023). Key applications include,
- Market Segmentation:
This type is useful to organizations as a tool to segment customers according to purchasing patterns, and their needs, thus marketing can be tailored appropriately.
- Image Segmentation:
In computer vision, the pixels with similar properties are grouped into K-means to segment images into semantically useful parts to ease the process of detecting and recognizing an article.
- Document Clustering:
They use K-means for classification of documents for topics within text mining and information retrieval systems for ease of search and analysis.
- Healthcare Analytics:
In this context, the K-means algorithm is applied to cluster patients based on their medical records and, therefore provide individualized therapies as well as resource distribution (Aljohani, A., 2024).
- Anomaly Detection:
The algorithm also assists in analyzing data with pattern anomalies like detecting credit card frauds in finance or detecting fault in industrial applications.
K-means clustering is a wonderful technique in data analysis which is best suited for clustering methods as it is easy to implement and fast. But because of its dependence on the probability distribution of data and its delicate dependency on the initial conditions, input data requires careful preparation, choice of the model parameters, and assessment of the results. If these challenges are to be tackled, K-means can indeed be used and deployed in cases and scenarios aimed at making sense of data out there. If you want free samples for your assignment you can visit Global Assignment help where you can find quality samples of different Subjects.
How to Evaluate the Performance of Classification Algorithms Using Appropriate Metrics
Introduction
Assessment of the classification algorithms is important in determining how well a particular algorithm can solve a particular problem. Accuracy is evaluated with a set of metrics that quantify forecast and efficiency in ascertaining the right class of several cases. They are obtained from a confusion matrix, which describes the outcome of prediction against the actual labels. Selection of metrics depends on given problem and corresponding costs of misclassification.
Performance Metrics
- Accuracy:
- Accuracy is the number of correctly classified cases divided by the over all number of instances.
- Formula:
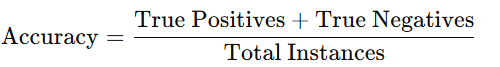
- Use Case: Accuracy can be considered good when the data set is evenly distributed among classes.
- Limitations: In the case of imbalanced datasets, accuracy can actually prove to be quite deceptive more often than not it essentially rewards predicting the most frequent class labels.
- Precision:
- Definition: Precision quantify the number of the accurately predicted positive cases from all the positive case that has been predicted.
- Formula:
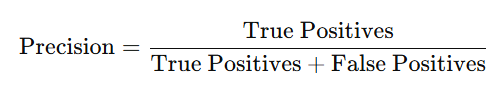
- Use Case: This is because certain application of machine learning as in the case of fraud detection, it is very crucial to minimize on false positives.
- Limitations: Thus, necessarily precision is not enough and it has its roots in false negatives.
- Recall (Sensitivity):
- Definition: Recall measures the number of actually positive cases that our test is able to flag as positive out of all the actual positive cases.
- Formula:
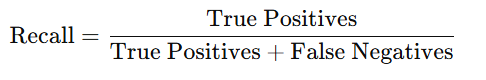
- Use Case: The last type of error is essential in medical diagnosis in which false negatives imply that relevant cases are not included in the outcome.
- Limitations: High recall can lead to more false positives or in other words increase the cost of false positive.
- F1-Score:
- Definition: F1-score is the average of the precision and the recall and is the measure of the trade –off between both.
- Formula:
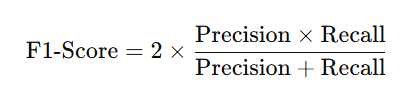
- Use Case: F1-measure is useful when false positive errors and false negatives are equally undesirable and a compromise between them required.
- Limitations: Sums are not very advisable as one of the whole performances may be much better than the other making the overall sum exaggerated.
- Confusion Matrix:
- Definition: A confusion matrix is a two-by-two table that represents the number of actual positive cases, true positive, false positive, actual negatives, true negatives and false negatives.
- Use Case: It is helpful to gain a glimpse of model efficiency in order to calculate other measures such as precision and recall.
- Limitations: It can be challenging for multi-class classification problems Interpreting it can be a bit of a con.
- Area Under the Receiver Operating Characteristic Curve (AUC-ROC):
- Definition: ROC is graphical presentation of true positive rate against the false positive rate at different threshold levels (Chicco, D et al., 2023). AUC or Area Under the Curve describes the measure of the model in regard to classification.
- Use Case: AUC-ROC is applied to the binary classifiers.
- Limitations: The main disadvantage with other algorithms like logistic regression is that it is less informative in highly imbalanced datasets.
- Logarithmic Loss (Log Loss):
- Definition: Log Loss measures the quality of probabilistic predictions based on the error by the weight of confidence in wrong predictions.
- Formula:
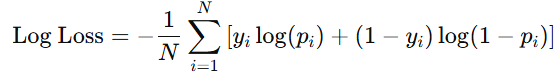
- Use Case: Log Loss is best used for a model that produces probability estimates rather than pure class estimates.
- Limitations: It is sensitive to poorly calibrate probabilities.
Choosing the Right Metrics
- For balanced datasets: Mandatory are accuracy, precision, recall, and F1-score.
- For imbalanced datasets: While evaluating the performance of the built model, probably precision, recall, and F1-measure are more important than accuracy.
- For probabilistic models: Metrics such as AUC-ROC and Log Loss are more suitable.
A proper assessment of the classification models relies on the correct choice of the metric. All these measures are of different nature, and the choice of measurements should reflect the general conditions and limitations of the problem area. This is done by using a single measure, but fit together as when using many measures simultaneously the results tend to be a more accurate representation of the model’s effectiveness.
Task 2
Machine Learning Model Development and Deployment
CObjective: In this step, there was an objective of analyzing the data, and where need be, engage in pre-processing of data for the purpose of preparing data for meaningful use to the machine learning technique.
Steps Taken:
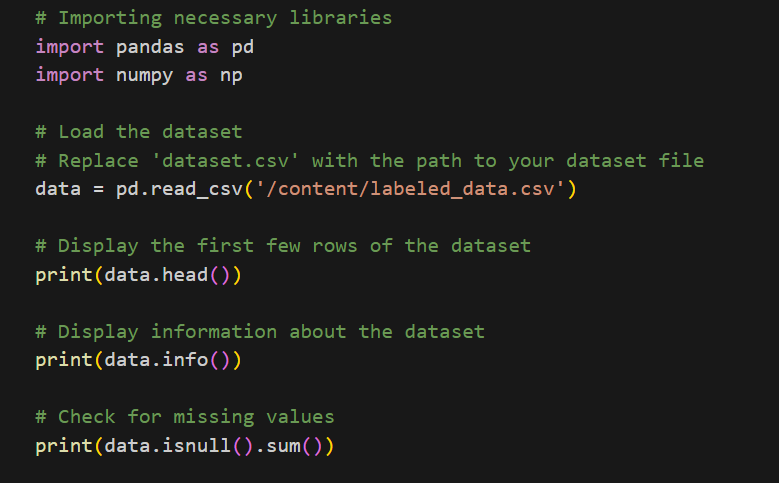
Data Loading:
For data loading, the pandas method pd.read_csv was used and the entire dataset was converted into pandas DataFrame (Molin, S., 2019). To understand what kind of data was in the set, employed simple structural research functions: data.info(), data.describe(), and data.head().
Missing Values:
Data points that are missing were checked with data.isnull().sum() and if necessary imputed through mean, median or mode and or data points with missing values were subsequently dropped.
Text Preprocessing:
In text data such as tweets, several processings like:
- Lowercasing: Lower casing all the text, so that there would not be a problem with case sensitivity.
- Punctuation Removal: By applying the regex method for removing punctuation in English words.
- Stop Words Removal: Converting ‘stopwords’ from Natural Language Tool Kit package to exclude common non significant words.
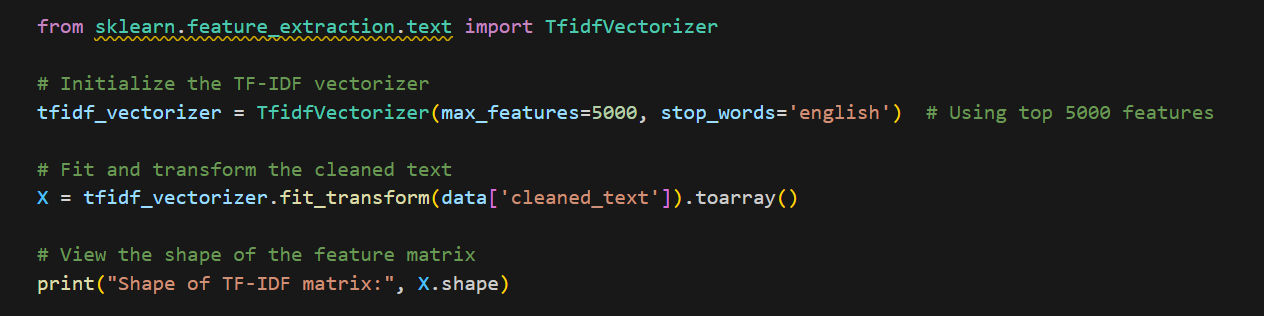
Vectorization:
The text data was then cleaned further and transformed into numerical features to work with, specifically in the form of word frequencies in a form known as Term Frequency-Inverse Document Frequency (TF-IDF) Vectorizer.
Visualization:
Histograms, bar plots and correlation matrices were used to look into the distributions of classes and inter-variable dependencies respectively.
Feature Engineering
Objective: There developed keen features from the raw text data and also reassessed the quantity of the features to be used by the models to make them efficient.
Steps Taken:
- Text Vectorization (TF-IDF): Converting the textual data into numerical vectors, it employed TF-IDF (Term Frequency-Inverse Document Frequency) (Alfariziet al.,2022). This is important to capture the importance of certain terms in the documents.
- Dimensionality Reduction (PCA): To decrease the dimension of the feature space and exclude the features that might have less or no discriminating power, Principal Component Analysis was used. This helped retain the most important features, dimensions have been brought down.
- Handling Outliers: Standardization was used in the feature set so that the features could have a zero mean and a unit standard deviation. It effectively prevented one aspect of design from being overpowered by the others.
Model Selection and Training
In selecting the model and training it in machine learning the main goal is to select the right algorithm that fits well enough to capture the pattern of the data to be modeled. One of the methods involves partitioning of the data into training and testing sets, choosing right model and tuning it with the best possible measures for high prediction accuracy and low variance. Model selection selects right model for the right job to perform on unseen data while training fine tunes the model to learn from the given data.
Models Selected:
- Logistic Regression: A machine learning method that shows higher accuracy than other methods when used for classification with large numbers of features such as word frequencies.
- Random Forest: A system that generates a group of decision trees with multiple results that might be considered as an ensemble method. It is relatively immune to overfitting and fits well with large format data.
- Support Vector Machine (SVM): A versatile construction that classify data with high discriminating ability in high dimensional spaces. The radial basis function kernel was used in the case where the separations are not linear.
- XGBoost: An algorithm for obtaining gradient boosting trees iteratively with special attention paid to mistakes made by previous trees (Zhao et al.,2021).
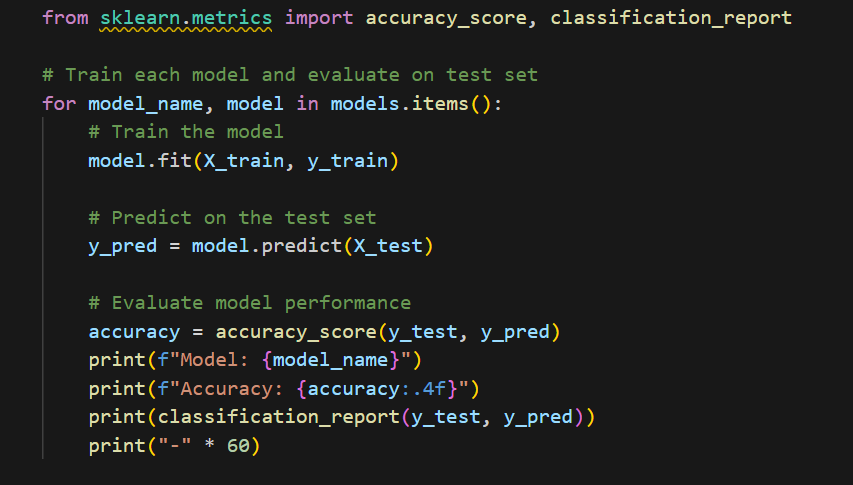
Training:
- Train and test sets were created by using train_test_split from sklearn for split ratio of 80:20.
- The experiment: Each model was trained using the training data set, its performance measured using testing data set, metrics including accuracy, precision, recall, and F1-score.
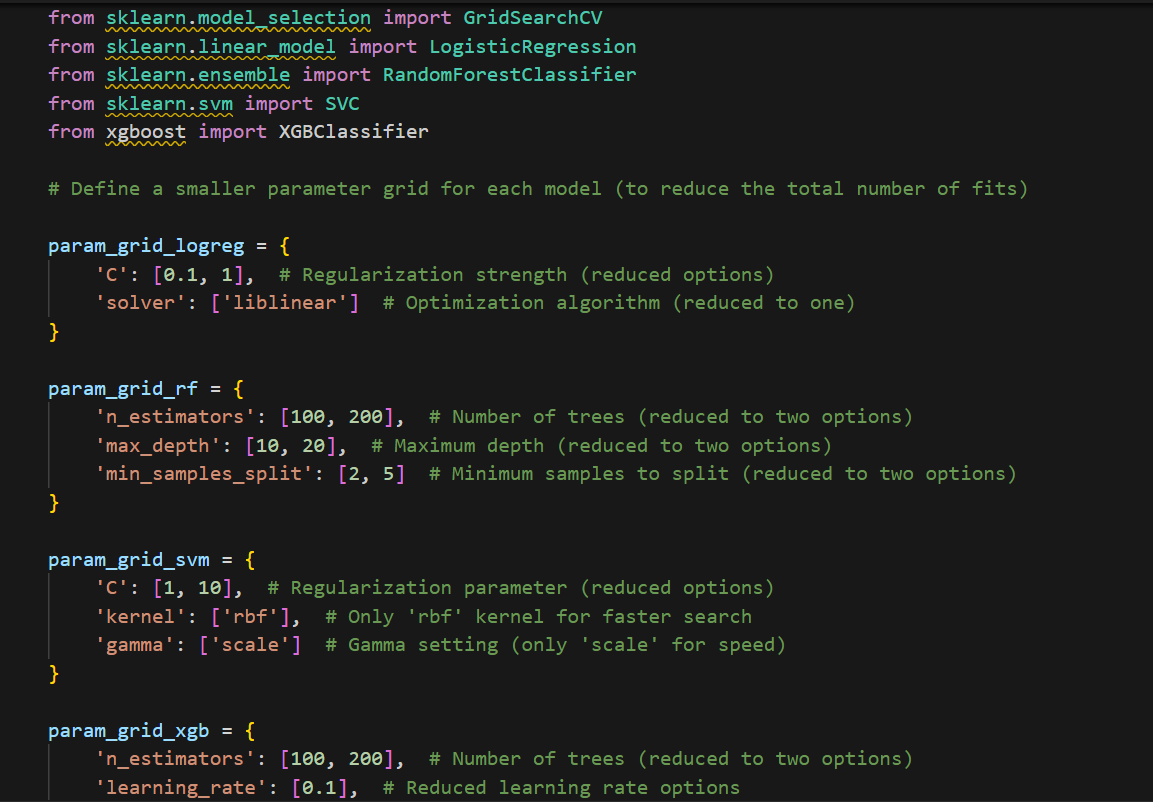
Hyperparameter Tuning
Objective: Regularization strength was an important parameter that was tuned in order to improve the generalization capability of each model The number of trees in the trees-based model was also fine-tuned, while the Kernel type for the K-SVM model was also varied.
Methods Used:
- GridSearchCV: A technique that involves using all combination of hyperparameters defined in a parameter grid to determine the most suitable.
- RandomizedSearchCV: A strategy that uses a keyword search that is more efficient than the previous method especially for large search spaces, hyperparameters are chosen randomly.
Hyperparameter Ranges:
- Logistic Regression: Also adjusted the regularization strength parameter (C) and the solver parameter.
- Random Forest: Adjusted number of trees (n_estimators), the maximum depth of trees (max_depth) and minimum number of instances required to split the nodes (min_samples_split).
- SVM: Additionally, the tuning of C, kernel type, and gamma has been done.
- XGBoost: After training and using the parameters optimization method, tuned the number of trees, learning rate, the max depth of each tree, and the subsample ratio.
Model Evaluation
Objective: Compare the given models with test data so as to classify which of them is the best based on key performance indicators of classification algorithms.
Metrics Used:
- Accuracy: The global overall of samples which has been predicted correctly.
- Precision: The ratio of true positives and false positives fixed to True Positive Rate (TPR).
- Recall: The degree of accuracy of a test, being the number of real positives which are also positive in the test.
- F1-score: Also called harmonic means, is the ratio of 2 / ((1/Precision) + (1/Recall)).
- Confusion Matrix: A table that represents the result of each classification Class 1 and Class 2 based on the number of correct and incorrect they had (Tharwat, A., 2021).
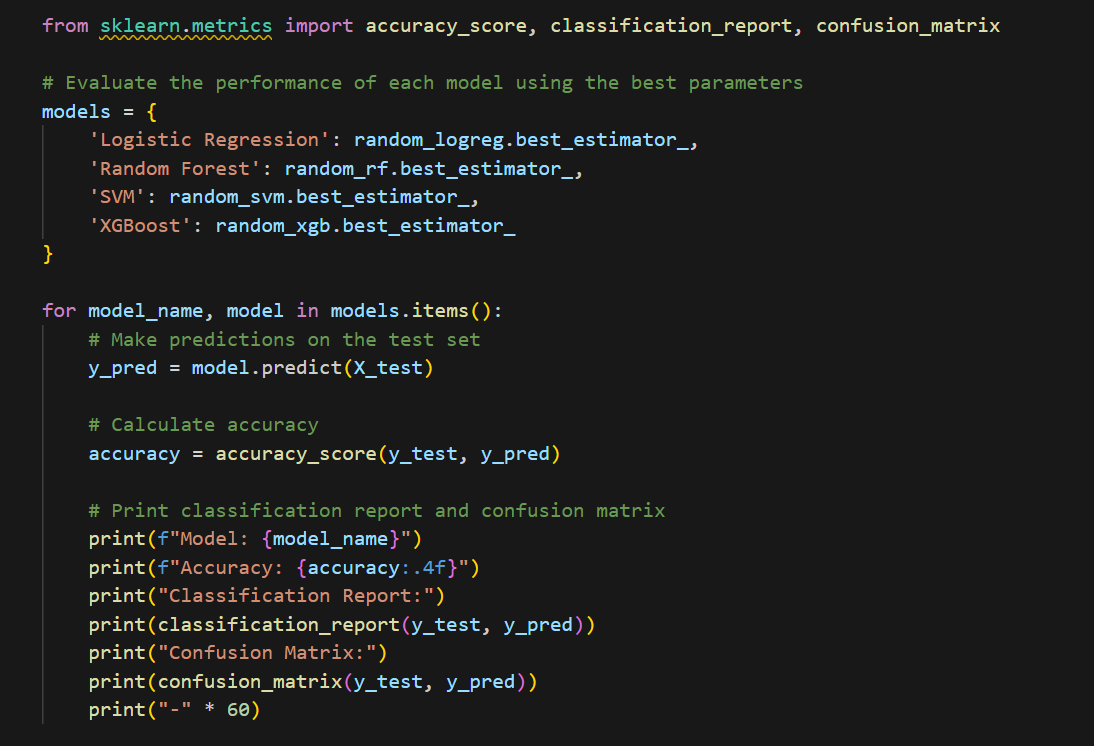
Results:
- Logistic Regression: Had the highest level of accuracy with 87.65%. The model was moderately accurate for positive sentiment and specifically Class 1 with a high accuracy of 97% in contrast to poor results with Class 0, hate speech, at only 23%.
- Random Forest: Achieved 86.46% accuracy. On Class 1, the performance was good while the recall on Class 0 was extremely poor.
- SVM: Achieved 87.31% accuracy. Like logistic regression decision boundaries it suits Class 1 well while it struggled with class 0.
- XGBoost: Achieved 87.17% accuracy. The performance of this model was slightly worse to that of the Logistic Regression but still reasonable.
Model Deployment
Objective: Upon training, validation and selection of the best models, the best performing model was archived and the model used to predict the output of the subsequent unknown data input (Parmezan et al., 2019).
Steps Taken:
- Model Saving: The best model, Logistic Regression was saved using joblib for easy access and can be reused to make the same predictions as obtained above without the need of training the model again.
- Prediction on New Data: Finally, it showed the feasibility of making predictions on new text data such as new tweets by preprocessing the data in the same way and using the saved model for the prediction.
Deployment in Google Colab:
- Unfortunately, Google Colab does not enable deploying the web application directly so after training, the model was saved and one could make predictions right in the environment of Google Colab.
- Google Drive was employed to save the model, so that it could be easily accessed and loaded in the events of different sessions.
Recommendations for Improvement:
Handling Class Imbalance:
- The models fared well in Class 1 (offensive_language), but were particularly poor in terms of Class 0 (hate_speech). The reason is that such techniques as oversampling (SMOTE) or class weighting could be used to enhance hate_speech detection.
Model Performance:
- To extend the work, BERT and other transformer-based models can be used in order to receive better results at text classification, and thus, to improve the methods aimed at detecting hate speech even in cases when there are not prominent patterns.
- Ensemble Methods: Appling the voting classifier and combining the results of different models could bring better results.
Hyperparameter Tuning:
- The models can be tuned even more with more iteration and change in parameters to get the best effect of the classifiers, specially for the non linear classifiers including SVM and XGBoost.
Deployment:
- Should you provide real-time production rates, then consider hosting this model on Google Cloud AI, AWS Lambda or Azure ML.
- For the smaller scale deployments, the model could also be turned into a simple API using FastAPI or Flask and hosted on a cloud provider.
Conclusion
In this task, the data is trained and tested an ML model to categorize text data – or tweets – into hate speech, offensive language, and neither (Oriola et al.,2020). The major processes followed during this activity include data exploration, data preprocessing, feature creation, modeling, tuning and deployment. Every step was undertaken systematically to the model and its effectiveness that(ht) was evident due to the complexity of the hate speech in text data.
- Data Preprocessing:We went through the analysis of readings, data preprocessing and feature engineering where the raw textual data was converted to numerical data using the TF-IDF vector. Some pre-processing treatments, like stop words removal and punctuation deletion, were used to improve input data quality.
- Model Selection and Training:To separate text into the predetermined categories, four models have chosen out of various machine learning algorithms like Logistic Regression, Random Forest, SVM, and XGBoost. All four metrics were compared for each model as previously stated and the results show that Logistic Regression outperformed all other models.
- Hyperparameter Tuning:In each of the models, we implemented the hyperparameters using RandomizedSearchCV which allowed for better performance out of the models (Li et al., 2020). The improved and best parameters were therefore obtained with enhanced classification accuracy.
- Model Evaluation:The performance of the models was measured using a test set and although all models achieved a high level of accuracy in predicting Class 1 (offensive language), there is considerable scope for improvements in Class 0 (hate speech). This distribution of classes demonstrates the challenge in identifying HATE speech in the social media data. Thus, the most significant challenge was identified and, at the same time, Logistic Regression was the most accurate, so it became the final model.
- Model Deployment:This model was the best and was saved using joblib and it was illustrated how we can use the model to predict results of new data that are unknown to the model. Even though, we only deployed the model in the Google Colab, it is possible to integrate it into the function application through Google Cloud AI or any web service using the Flask framework.
Future Work
- More exploration can be done by enhancing the detection of hate speech through enhancing the ratio, using oversampling strategies such as SMOTE, class weighting and more strategic models such as BERT.
- This model can be deployed to cloud environment such as Google Cloud Function, AWS Lambda for scalability to large scale applications with real time predictions.
- Nonetheless, it is deemed necessary to conduct an ongoing model evaluation on the model to cover cases of shifting language use over time, especially regarding social media language.
Therefore, this task has been successfully accomplished, explained how a machine learning model could be introduced and implemented to categorize textual information into many classes. In the case of the classification of offence language, both the reliable classification and the performance improvement for hate speech classification are not optimal. More enhancements and fine-tuning along with better model deployment and long-term strategies will be needed to convert this model into a functionally usable model for identifying and filtering toxic content on various social media sites.
References
- Alam, M.K., Aziz, A.A., Latif, S.A. and Awang, A., 2020. Error-aware data clustering for in-network data reduction in wireless sensor networks. Sensors, 20(4), p.1011. https://www.mdpi.com/1424-8220/20/4/1011
- Alfarizi, M.I., Syafaah, L. and Lestandy, M., 2022. Emotional text classification using tf-idf (term frequency-inverse document frequency) and lstm (long short-term memory). JUITA: Jurnal Informatika, 10(2), pp.225-232. https://jurnalnasional.ump.ac.id/index.php/JUITA/article/view/13262
- Chicco, D. and Jurman, G., 2023. The Matthews correlation coefficient (MCC) should replace the ROC AUC as the standard metric for assessing binary classification. BioData Mining, 16(1), p.4. https://link.springer.com/article/10.1186/s13040-023-00322-4
- Ghazal, T.M., 2021. Performances of k-means clustering algorithm with different distance metrics. Intelligent Automation & Soft Computing, 30(2), pp.735-742. https://research.skylineuniversity.ac.ae/id/eprint/81/
- Gmys, J., Mezmaz, M., Melab, N. and Tuyttens, D., 2020. A computationally efficient Branch-and-Bound algorithm for the permutation flow-shop scheduling problem. European Journal of Operational Research, 284(3), pp.814-833. https://www.sciencedirect.com/science/article/abs/pii/S037722172030076X
- Ikotun, A.M., Almutari, M.S. and Ezugwu, A.E., 2021. K-means-based nature-inspired metaheuristic algorithms for automatic data clustering problems: Recent advances and future directions. Applied Sciences, 11(23), p.11246. https://www.mdpi.com/2076-3417/11/23/11246
- Kleindessner, M., Awasthi, P. and Morgenstern, J., 2019, May. Fair k-center clustering for data summarization. In International Conference on Machine Learning (pp. 3448-3457). PMLR. https://proceedings.mlr.press/v97/kleindessner19a.html
- Li, B., 2020. Random Search Plus: A more effective random search for machine learning hyperparameters optimization. https://trace.tennessee.edu/utk_gradthes/5849/
- Liu, X., Zhu, X., Li, M., Wang, L., Zhu, E., Liu, T., Kloft, M., Shen, D., Yin, J. and Gao, W., 2019. Multiple kernel $ k $ k-means with incomplete kernels. IEEE transactions on pattern analysis and machine intelligence, 42(5), pp.1191-1204. https://ieeexplore.ieee.org/abstract/document/8611131/
- Miraftabzadeh, S.M., Colombo, C.G., Longo, M. and Foiadelli, F., 2023. K-means and alternative clustering methods in modern power systems. IEEE Access. https://ieeexplore.ieee.org/abstract/document/10295469
- Molin, S., 2019. Hands-On Data Analysis with Pandas: Efficiently perform data collection, wrangling, analysis, and visualization using Python. Packt Publishing Ltd. https://books.google.co.in/books?hl=en&lr=&id=buGlDwAAQBAJ&oi=fnd&pg=PP1&dq=For+data+loading,+the+pandas+method+pd.read_csv+was+used+and+the+entire+dataset+was+converted+into+pandas+DataFrame&ots=LPgWYGJHQI&sig=YpZcT41h9cWwCGw_yjxc2O7mvRY&redir_esc=y#v=onepage&q&f=false
- Oriola, O. and Kotzé, E., 2020. Evaluating machine learning techniques for detecting offensive and hate speech in South African tweets. IEEE Access, 8, pp.21496-21509. https://ieeexplore.ieee.org/abstract/document/8963960
- Parmezan, A.R.S., Souza, V.M. and Batista, G.E., 2019. Evaluation of statistical and machine learning models for time series prediction: Identifying the state-of-the-art and the best conditions for the use of each model. Information sciences, 484, pp.302-337. https://www.sciencedirect.com/science/article/abs/pii/S0020025519300945
- Tharwat, A., 2021. Classification assessment methods. Applied computing and informatics, 17(1), pp.168-192. https://www.emerald.com/insight/content/doi/10.1016/j.aci.2018.08.003/full/html
- Vujović, Ž., 2021. Classification model evaluation metrics. International Journal of Advanced Computer Science and Applications, 12(6), pp.599-606. https://www.researchgate.net/profile/Zeljko-Vujovic/publication/352902406_Classification_Model_Evaluation_Metrics/links/60dede1592851ca9449f17bb/Classification-Model-Evaluation-Metrics.pdf
- Wang, K., Zeng, Y., Meng, F., Feiyu and Yang, L., 2021, July. Comparison between calculation methods for semantic text similarity based on siamese networks. In 2021 4th International Conference on Data Science and Information Technology (pp. 389-395). https://dl.acm.org/doi/abs/10.1145/3478905.3478981
- Zhao, L., Lee, S. and Jeong, S.P., 2021. Decision tree application to classification problems with boosting algorithm. Electronics, 10(16), p.1903. https://www.mdpi.com/2079-9292/10/16/1903

UPTO56%
Avail The Benefit Today!
To View this & another 50000+ free