INTRODUCTION
This report provides a comparison of Sage Group plc and Relx plc on their financial position and performance of their companies in the technology and information services industries. Sage deals in ERP systems and has a vast array of products such as accounting, payroll and CRM software. They are mainly aimed at SMEs, which makes Sage a key factor in meeting the needs of this market segment (Eun et al., 2021). However, Relx plc targets to provide solutions of high analytical and decision-making support to the professional markets in law, science, medicine and business & intelligence. It is a company with an extensive portfolio of digital products and a rather sound subscription business.

In the current and upcoming periods, growth factors include geography expansion, new product development, and acquisition in order to countercheck rivals like Intuit and Oracle NetSuite. At the same time, Relx focuses on innovation through data and market in such countries; it is positioned in opposition to Thomson Reuters and Elsevier. (Hayden, Mattimoe and Jack, 2021).

From the key financial ratios of profitability, liquidity, and leverage, this report analyses the financial performance of these organizations for fiscal years 2023 and 2022 with reference to investor perception. Also, it takes into consideration the qualitative performance measure that include; sustainability innovation, and customer satisfaction. In the last section, the author discusses how AI, competition, and new customer behaviours affect the organizational strategies of both.
PART 1: PERFORMANCE EVALUATION USING RATIO ANALYSIS
Liquidity ratios:

RELX (2023)

Figure 3 – Liquidity Ratio of Sage Group plc and Relx plc
Interpretation:
The analysis of liquidity ratios of Sage Group plc and Relx plc for the fiscal years 2022 and 2023 are discussed below:
The current ratio of Sage Group plc enhanced from 0.67 in the financial year 2022 to 0.94 in the financial year 2023. However, the ratio remains significantly below the ideal benchmark of 2:1, indicating that one may have difficulties in responding to emergent financial demands (Amoa-Gyarteng, 2021). Meanwhile, another Tobacco player Relx plc’s current ratio has decreased from 0.59 in 2022 to 0.52 in 2023, which shows that the company has become less liquid. This decline can be due to high current liabilities or perhaps proper management of cash by investing it in long term assets.
Another measure of liquidity risks is cash ratios. Sage has a slight increase in its cash ratio from 0.37 in 2022 to 0.59 in 2023, which shows that cash management has its improvement but still lower than the industry average of 1. The cash ratio also reduced from 0.53 in 2022 to 0.50 in 2023, meaning less cash reserve was available. Such ratios are lower than the industry mean current ratios of 1.5 and the cash ratios of 1 indicating that both these companies require strengthening of liquidity to withstand shocks (Andiena et al., 2024).
Profitability Ratios:


Figure 4 – Profitability ratios of Sage Group plc and Relx plc
Interpretation:
Profitability ratios reveal the efficiency of earnings generation by Sage and Relx. Sage has managed to report a rise in its revenue from 2022 to 2023, but its net profit margin declined from 13.35% to 9.66% implying that the firm’s costs or its ability to control costs and convert its revenues into profits have deteriorated (Azwari, Febriansyah and Jayanti, 2022). This could be as a result of increasing operating costs or putting in place lowered product prices which competitors are offering. On the other hand, Relx’s net margin was significantly higher and marginally better in the current year with 19.08% in 2022 and 19.52% in 2023. This improvement shows that Relx has increased the capability to keep costs low and operations running efficiently.
Return on Assets (ROA) goes further in displaying the usage of assets. A decrease in efficiency in generating income from its assets is evident from a reduction in Sage’s ROA from 6.67% in 2022 to 5.36% in 2023 (Blessing and Sakouvogui, 2023). Its ROA though reduced to 10.31% in 2022 from 11.99% in 2023 indicates the correct employment of assets in generating income. Relx’s overall profitability is within the 8-12% range, and thus is in a better condition than Sage.
Leverage Ratios


Figure 5 – Leverage ratios of Sage Group plc and Relx plc
Interpretation:
Consequently, the leverage ratios give information on the companies’ capital structure and financial risks. Sage’s debt to equity ratio has also increased slightly from 1.79 in the year ending 2022 to 1.80 in the year ending 2023 (Jihadi et al., 2021). This means that the company has fairly relied on debt financing but with high level of debt that limits the cash flows and increase the financial risk. Relx has a higher debt to equity ratio that elevated from 3.22 in the year ended 2022 to 3.34 in the year ended 2023 implying more borrowing than equity.
The interest coverage ratio shows how well both firms are in meeting their debt related expenses. Sage’s ratio reduced from 11.84:1 in the year 2022 to 7:1 in the year 2023 which shows that company’s operating income has reduced in comparison to the interest expenses of the company. In the same way, Relx’s interest coverage ratio decreased from 11.33 in 2022 to 8.30 in 2023 (Lim and Rokhim, 2020). Despite the declines, both companies have sufficient capacity to cover interest payments, but their performance lags behind industry averages of approximately 15:1. This trend suggests the need to manage the debts better to avert other associated risks with higher interest costs.
Working capital ratios:


Figure 6 – Working capital ratios of Sage Group plc and Relx plc
Interpretation:
The working capital ratios indicate the short-term resource management of both of the companies. Accounts payable days at Sage reduced from 960.00 in 2022 to 872.31 in 2023 which shows that Sage pays its suppliers faster. Although it implies enhanced ability in managing cash, the figure is still high compared to industry average of 60-90 days, which imply inefficiencies (Muhammad Reza Handyansyah and Subiakto Sukarno, 2023). Likewise, the of Sage’s accounts receivable days reduced from 65.64 in 2022 to 61.98 in 2023 which means quicker collection of receivables from customers and better working capital.
Relx also managed to record working capital efficiency gain within the same period. The accounts payable days were 474.92 in 2022 and 444.51 in 2023, which mean that payments to the suppliers were made faster or the company was trying to avail early payment discount (Olayinka, 2022). Accounts receivable days reduced from 101.23 to 91.29, which means improved collection from customers.
Valuation ratios:

Figure 7 – Investor ratios of Sage Group plc and Relx plc
Interpretation:
Valuation ratios provide insights into investor sentiment and future growth potential. Sage’s earnings per share (EPS) decreased from £0.25 in 2022 to £0.21 in 2023, reflecting reduced profitability and potential challenges in sustaining growth. Conversely, Relx’s EPS rose from £0.85 in 2022 to £0.94 in 2023, signaling improved profitability and robust operational performance (Yenni et al., 2021).
The price-to-earnings (P/E) ratio of Sage increased from 27.08 in 2022 to 47.89 in 2023, suggesting heightened market expectations or overvaluation relative to earnings. Relx’s P/E ratio increased from 32.63 in 2022 to 41.47 in 2023, reflecting investor confidence without the extreme valuation seen in Sage.
Relx’s balanced P/B ratio makes it a more attractive option for risk-averse investors. Sage, despite its growth potential, presents a higher-risk profile that may deter conservative investors (Revsine, Collins and Johnson, 2021).
PART1: PERFORMANCE EVALUATION USING RATIO ANALYSIS

Order our assignment help service

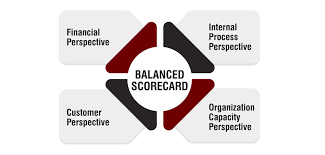
PART 2: BALANCED SCORECARD
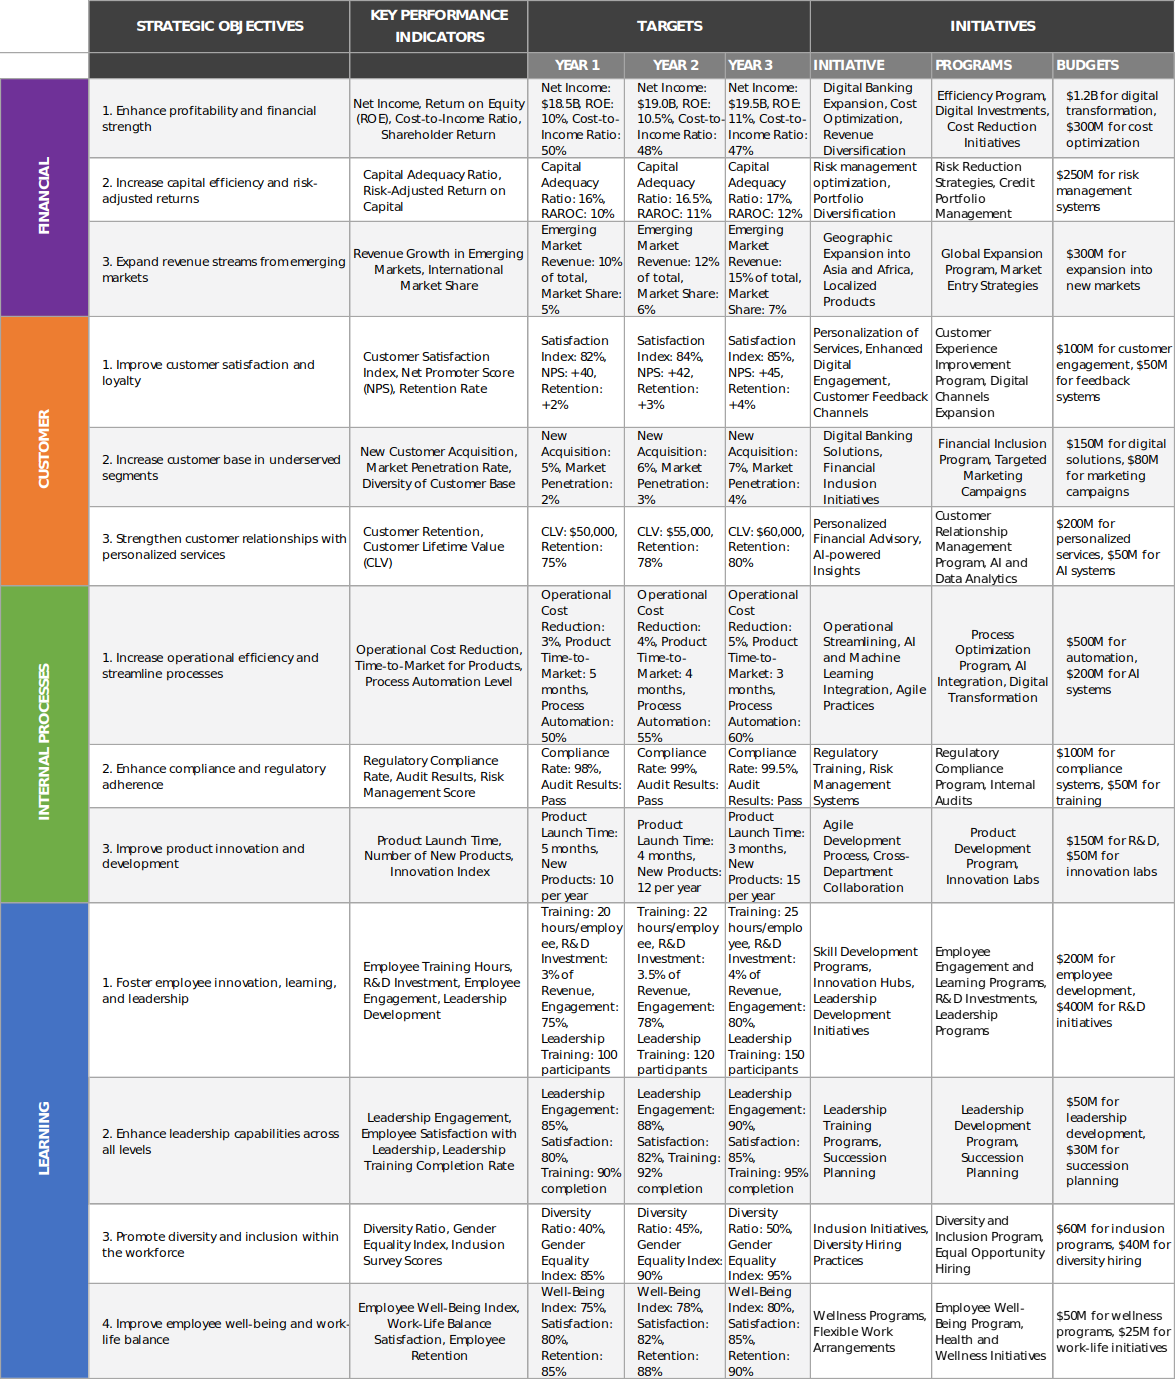
Figure 8 – BSC of Sage plc
The Balanced Scorecard (BSC) framework facilitates strategic performance management by linking an organization’s vision and strategy to specific, actionable objectives across four perspectives: These are financial, customer, internal business process, and learning and growth (Aziz and Dewanto, 2022). To Sage Group PLC, an international business software solutions firm, this approach offers a systematic way of linking non-financial performance indicators with the firm’s objectives. The following section adds SMART objectives, measures and targets to Sage’s BSC with reference to prior feedback and provides a critical analysis of how it compares to Relx PLC.
1. Financial Perspective
The Financial Perspective lays emphasis on the generation of shareholder value with the help of profitability and proper use of resources (Betto et al., 2022). The strategic priority of company is to remain financially stable by achieving a continuous growth. It is provided in reference to subscription-based business model.
Objective 1: Raise net income by 10% by the end of fiscal year 2023.
- Measure:Annual net income growth.
- Target:Generate £350 million of net income by December of 2023.
- Initiative:Increase the subscription revenue base by encouraging customers to use their subscriptions with more features and by focusing on add-ons.
Objective 2: ROCE should be enhanced to 15% by the financial year ending in 2023.
- Measure:ROCE percentage.
- Target:To achieve ROCE of 15% by end of 2023.
- Initiative:Invest in revenue generation programs such as product differentiation targeting profitable products markets and cutting on costs.
Critical Evaluation: These are quantifiable and are part of Sage’s strategic plan to improve profit and balance sheet returns (Bohm et al., 2021). However, any change must be monitored for trade-offs such as, decreases in operating costs harming customers or hindering innovation.
2. Customer Perspective
Since its focus is on satisfying the customers and enhancing their loyalty along with a market share the Customer Perspective is all about meeting these new needs of the customers. Sage mainly focuses on the SMEs market that needs affordable and dependable solutions.
Objective 1: Customer satisfaction scores should be upped by 5% to 90% by the end of the fiscal year 2023.
- Measure: Customer satisfaction index.
- Target: To achieve the 90% satisfaction index by December 2023.
- Initiative: Automating help-desk solutions to shorten response times.
Objective 2: Increase the market share in the SME software segment from 12% to 14% in FY 2023.
- Measure:Market share percentage.
- Target:Increase the company’s market share to 14 percent by December 2023.
- Initiative:Organize important advertising campaigns based on eligibility to preserve and simplicity.
Critical Evaluation: These objectives show a clear fit with Sage’s organisational culture of putting the customer first (Carayannis et al., 2022). However, the strategic balance between growth and the quality of services is of paramount importance in order not to lose customers.
3. Internal Processes perspective
This perspective emphasises cost reduction and new product development. Sage’s main goals are to decrease time-to-market and to maximize value within the company (De Jesus Alvares Mendes Junior and Alves, 2022).
Objective 1: Reduce new product development cycle time from 14 weeks to 10 weeks by FY 2023.
- Measure:An average time taken to complete a development cycle.
- Target: Deliver full development cycles within 10 weeks by December 2023.
- Initiative:Implementation of agile practices together with improving organization’s cross-functional team’s coordination.
Objective 2: Cut operating expenses by 5 percent in FY 2023.
- Measure:Percentage cost reduction.
- Target:Decrease the operational cost of the organization by 5% by December 2023.
- Initiative:Increase the use of automation systems and cut all the unnecessary procedures.
Critical Evaluation: These objectives are in line with Sage’s goal of optimality, however, there is danger of being too prescriptive in the way work is done and therefore not being able to adapt to changes in the markets.
4. Learning & Growth Perspective
The Learning & Growth Perspective is all about employee growth and innovation for the sustainability of the business (Hegazy, Hegazy and Eldeeb, 2022). Sage also spends a lot of money in research and development, and in training of its employees.
Objective 1: Raise average of annual training hours per employee from 20 to 25 hr before the end of fiscal year 2022/2023.
- Measure:Compared to 2001, overall training hours per employee were lower in 2004, and average training hours per employee were also lower.
- Target:Offer at least 25 training hours for every employee by December 2023.
- Initiative:Collaborate with other institutions to provide higher level technical and people skills education.
Objective 2: Increase R&D expenditure to five and half percent of its revenues by the financial year ending March 2023.
- Measure:The next measure of innovation investment is R & D expenditure expressed as a percentage of revenue.
- Target: Spending for R&D should be at least 6% of revenue by December 2023.
- Initiative: Emphasis on such areas as the use of AI in software products.
Critical Evaluation: These objectives are crucial for generating innovations and setting up the engagement of the employees. Main emphasis is on raising company’s R&D budget, which must be accompanied by the delivery of specific results to cover costs and gain shareholders’ support.
5. Causal Comparative Analysis and its Strategic Significance
One of the competitors in analytics and information services, Relx PLC, has a clear strategic orientation. Whereas, Sage focuses on business optimization and customer experience, Relx focuses on the digital and data-led product development. For example, Relx wants to extend the use of artificial intelligence throughout its portfolio, which is a more comprehensive concept of market disruption (Mio, Costantini and Panfilo, 2021). On the other hand, Sage focuses on developing its principal SME solutions while expanding its customer base.

Figure 10 – SAS Software
Source – SAS (n.d.)
Key Differences:
- Customer Focus:Relx focus some of its business on a particular enterprise segment while Sage continues to sell to small and medium enterprise market offering mostly affordable easy to use products.
- Innovation:Sage on the other hand has increased its R&D spend by a mere 0.7% of its revenue while Relx spent 8% of its revenue on it, which highlights that the two companies have different innovation extents (Jassem, Zakaria and Che Azmi, 2021).
- Growth Strategies:Relx focuses on M&As as a key strategic development mode, whereas Sage prefers to rely on new product development from existing products.
PART2: BASIC BALANCED SCORECARD TEMPLATE
Order our assignment help service
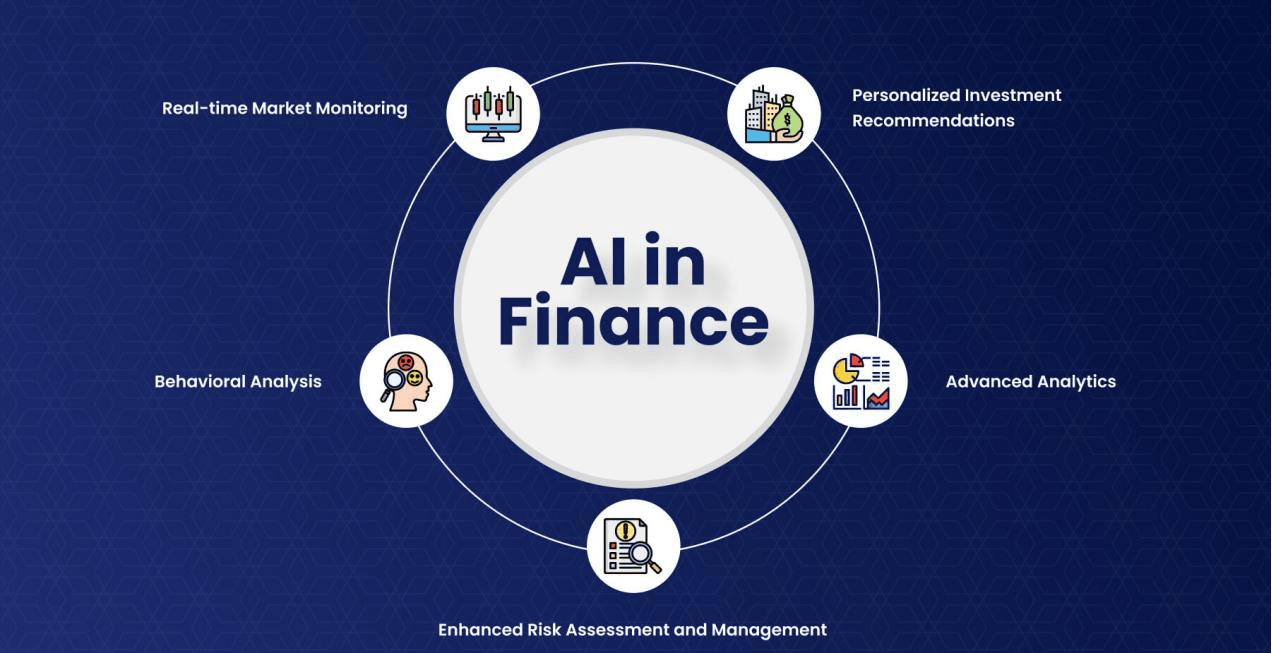
PART 3: AI FINANCIAL MANAGEMENT AND DECISION-MAKING IMPLICATIONS
Introduction
AI has thus established itself as a game changer in financial management across operations, strategic planning and more importantly, innovation. In the case of Sage Group PLC that supplies business software to SMEs, integration of AI is a fundamental strategy that can help the firm to keep up with competition in the new era (Bag et al., 2021). This paper focuses on specific examples of AI application in financial management, the problems that may arise in this connection, as well as the overall strategic implications of this process in the context of the CFO’s and financial manager’s work.
AI in financial management: Applications
1. Cost Optimization
- Innovations and Resource Economy: Based on the paper, AI optimizes accounts payable, receivable, and expenses, cuts costs, and decreases the probability of errors (Cao et al., 2021). The case of automating invoice processing for instance allows Sage to process large volumes with higher accuracy. Studies show that this kind of automation can reduce the expenses by 20% or more and it is going to directly assist Sage’s SME clients, who are looking for cost efficient solutions.
- Fraud detection and credit risk assessment:AI applications can identify irregularities when processing transaction data in real time and protect the clients ‘money (Strich, Mayer and Fiedler, 2021). In credit risk assessment, predictive models analyse historical and behavioural data to assess credit risk, which helps Sage to extend the right financial solutions to its clients.
- Top Line Growth and Customer Understanding: To be more precise, AI improves customer experiences by understanding the patterns and preferences. Currently, subscription services contribute to over 75 % of total revenues and Sage has applied machine learning to make improvements to the pricing of its subscription models. Value added information build customer loyalty and reveal hidden value sales potential.
- Risk Management and Forecast: Machine learning is used to help study the trends in the market and risks involved. Sage uses these factors to consider future economic changes or loss of customers, in order to act proactively (Haider Ali Javaid, 2024). Such capabilities remain useful in managing business operations and risk in a given business climate to avoid disruption.
Challenges of AI Adoption
However, it is important for Sage to note that the adoption of AI is associated with appreciable challenges as highlighted next.
- Implementation Costs: Integrating AI involves a big outlay on infrastructure, integration, and employee training. Nevertheless, Sage has the financial capabilities to pay for such costs, the focus on ROI-related implementation is crucial to maintain financial viability (M. Alshater, 2022).
- Workforce Adaptation: The implementation of AI interferes with conventional processes of work and necessitates staff training. Sage needs to take time and develop human resource training that will enhance its workforce while at the same time allaying the fears of job loss through AI-human integration.
- Bias and Fairness: Models trained on datasets with bias can become a carrier of such bias in an organization and especially when used in decision making such as in finances (Mogaji, Soetan and Kieu, 2020). For example, biased credit assessments can offend a particular group of customers. Sage cannot afford not to do ethical AI since; now it must incorporate inclusiveness and fairness.
- Ethical and regulatory considerations: Clients demand more openness when it comes to AI decision making. Ethical issues can be solved using explainable AI and by following guidelines of AI business practices, so Sage will be trusted (Sestino and De Mauro, 2021).
Strategic Management for CFOs and Financial Managers
AI does not only enhance various operations within Sage but also supports key choices for CFOs and other financial managers.
- Strategic Planning Based on Facts: AI tools help the CFO to make virtual modeling and forecasting. For instance, Sage can leverage these tools to evaluate the effects that create market penetration strategies or introduction of new products with assistances of artificial intelligence over the long-term goals.
- Enhanced Investment Analysis: AI makes it easy to assess big data and improve on the management and distribution of resources. That way at Sage it is possible to funnel money into areas that promise high returns such as cloud services or cutting edge AI products for sustainable competitive advantage.
- Real time Performance Measurement:AI tools assist in setting benchmarks and detecting variations from the standard and respond quickly to meet these deviations.
- Fostering Innovation: Through the use of AI in financial processes, Sage situates itself as a leader in the use of AI in the advancement of innovation for SMEs. Apart from winning clients, this also enhances Sage’s position among the leading technology providers of financial software solutions.
Solution for Strategic AI application
To maximize the benefits of AI while mitigating challenges, Sage should adopt the following strategies:
- Phased Implementation: It also helps to avoid the risk of disruption and enables Sage to understand the effectiveness of the application of AI at various stages (Stone et al., 2020). Thus, starting from fraud detection and financial reporting guarantees reasonably controlled risks and tangible results.
- The Training and Reskilling of Employees: Sage’s management invests in upskilling programs to guarantee that the firm’s workforce has the ability to work with AI tools. Relations with technology vendors and academic partners can help to advance talent management.
- Ethical AI Adoption: Ethical rules creation helps to prevent the misuse of artificial intelligence, and create equal conditions for its use (Hazem et al., 2024). Such a system as the described Sage should give importance to explain ability to preserve the client’s trust.
- Integrating AI with its Strategic Objectives: CFOs should use AI to drive important initiatives like increasing efficiency, retaining customers, and driving innovation to maintain Sage’s leadership in the market.
CONCLUSION
Therefore, this report has given an evaluation of the financial health, non-financial performance and strategic management of Sage Group plc and Relx plc using the necessary financial ratios, performance evaluation and the effect of innovative technology like Artificial Intelligence (AI). Each company is dominating its industry, but their financial and operational models are quite dissimilar. Considering the recent shift in Sage’s focus to AI and cloud-based products, there are several opportunities for improvement mostly in the area of operations and customers. However, the implementation of these technological innovations requires the firm to consider the extraordinarily high costs, security threats to the data.
On the hand, Relx plc has higher profitability ratios and better efficiency of assets as compared to American Water Works. Nevertheless, Relx has to view innovation and sustainability as its major priorities, which can help the company to address problems in a constantly changing market. All in all, based on Sage Group’s focus on innovations and strategic development, especially with the help of AI, the company reveals all signs of long-term perspectives. But to continue being relevant it has to manage its liquidity risks, increase its profitability and ensure that its human capital is right for the new technological age. While the two companies have different problems, they have to develop further due to the changes in technology and the market.
REFERENCES
Books and Journals
- Amoa-Gyarteng, K. (2021) Corporate Financial Distress: The Impact of Profitability, Liquidity, Asset Productivity, Activity and Solvency, Journal of Accounting, Business and Management (JABM), 28 (2) p.104. DOI: https://doi.org/10.31966/jabminternational.v28i2.447
- Andiena, P. et al. (2024) FINANCIAL PERFORMANCE ANALYSIS OF COMPANIES THROUGH LIQUIDITY AND PROFITABILITY RATIO APPROACHES, Journal of Economic, Bussines and Accounting (COSTING), 7 (6) pp.5317–5320. DOI: https://doi.org/10.31539/costing.v7i6.12949
- Aziz, N. and Dewanto, I. J. (2022) Model Penilaiann Kinerja Karyawan dengan Personal Balanced Scorecard: (Studi Kasus Universitas Tangerang Raya), MAMEN: Jurnal Manajemen, 1 (2) pp.168–177. DOI: https://doi.org/10.55123/mamen.v1i2.218
- Azwari, P. C., Febriansyah, F. and Jayanti, S. D. (2022) Impact of Third-Party Funds and Capital Adequacy Ratio on Profit Sharing Financing, International Business and Accounting Research Journal, 6 (1) pp.63–70. DOI: https://doi.org/10.35474/ibarj.v6i1.236
- Bag, S. et al. (2021) An integrated artificial intelligence framework for knowledge creation and B2B marketing rational decision making for improving firm performance, Industrial Marketing Management, 92 (1) pp.178–189. DOI: https://doi.org/10.1016/j.indmarman.2020.12.001
- Betto, F. et al. (2022) The Evolution of Balanced Scorecard in Healthcare: A Systematic Review of Its Design, Implementation, Use, and Review, International Journal of Environmental Research and Public Health, 19 (16) p.10291. DOI: https://doi.org/10.3390/ijerph391610291
- Blessing, H. and Sakouvogui, G. (2023) Impact of Liquidity and Solvency Ratios on Financial Performance: A Comprehensive Analysis, Indonesia Auditing Research Journal, 12 (3) pp.102–115. DOI: https://doi.org/10.35335/arj.v12i3.208
- Bohm, V. et al. (2021) Scoping review of balanced scorecards for use in healthcare settings: development and implementation, BMJ Open Quality, 10 (3) p.e001293. DOI: https://doi.org/10.1136/bmjoq-2020-001293
- Cao, G. et al. (2021) Understanding managers’ attitudes and behavioral intentions towards using artificial intelligence for organizational decision-making, Technovation, 106 (106) p.102312. DOI: https://doi.org/10.1016/j.technovation.2021.102312
- Carayannis, E. et al. (2022) Balanced-Scorecard-Based Evaluation of Knowledge-Oriented Competencies of Distributed Energy Investments, Energies, 15 (21) p.8245. DOI: https://doi.org/10.3390/en15218245
- De Jesus Alvares Mendes Junior, I. and Alves, M. D. C. (2022) The balanced scorecard in the education sector: A literature review, Cogent Education, 10 (1) DOI: https://doi.org/10.1080/2331186x.2022.2160120
- Eun, C. S., Resnick, B. G. and Chuluun, T. (2021) International financial management. (s.l.): McGraw-Hill.
- Haider Ali Javaid (2024) The Future of Financial Services: Integrating AI for Smarter, More Efficient Operations, MZ Journal of Artificial Intelligence, 1 (2)
- Hayden, M. T., Mattimoe, R. and Jack, L. (2021) Sensemaking and financial management in the decision-making process of farmers, Journal of Accounting & Organizational Change, ahead-of-print (ahead-of-print) DOI: https://doi.org/10.1108/jaoc-11-2020-0186
- Hazem, M. et al. (2024) Leveraging Artificial Intelligence for Strategic Business Decision-Making: Opportunities and Challenges. Available at: https://philpapers.org/rec/HAMLAI
- Hegazy, M., Hegazy, K. and Eldeeb, M. (2022) The Balanced Scorecard: Measures That Drive Performance Evaluation in Auditing Firms, Journal of Accounting, Auditing & Finance, 37 (4) pp.902–927. DOI: https://doi.org/10.1177/0148558x20962915
- Jassem, S., Zakaria, Z. and Che Azmi, A. (2021) Sustainability balanced scorecard architecture and environmental performance outcomes: a systematic review, International Journal of Productivity and Performance Management, 71 (5) pp.1728–1760. DOI: https://doi.org/10.1108/ijppm-12-2019-0582
- Jihadi, M. et al. (2021) The Effect of Liquidity, Leverage, and Profitability on Firm Value: Empirical Evidence from Indonesia, The Journal of Asian Finance, Economics and Business, 8 (3) pp.423–431.
- Lim, H. and Rokhim, R. (2020) Factors affecting profitability of pharmaceutical company: an Indonesian evidence, Journal of Economic Studies, ahead-of-print (ahead-of-print) DOI: https://doi.org/10.1108/jes-01-2020-0021
- M. Alshater, M. (2022) Exploring the Role of Artificial Intelligence in Enhancing Academic Performance: A Case Study of ChatGPT. Available at: https://papers.ssrn.com/sol3/papers.cfm?abstract_id=4312358
- Mio, C., Costantini, A. and Panfilo, S. (2021) Performance measurement tools for sustainable business: A systematic literature review on the sustainability balanced scorecard use, Corporate Social Responsibility and Environmental Management, 29 (2) pp.367–384. DOI: https://doi.org/10.1002/csr.2206
- Mogaji, E., Soetan, T. O. and Kieu, T. A. (2020) The implications of artificial intelligence on the digital marketing of financial services to vulnerable customers, Australasian Marketing Journal (AMJ), 29 (3) DOI: https://doi.org/10.1016/j.ausmj.2020.05.003
- Muhammad Reza Handyansyah and Subiakto Sukarno (2023) Influence of Liquidity Ratio, Solvency Ratio, Profitability Ratio, Market Value Ratio, and Total Asset on Stock Return in Companies Listed in the Indonesia Stock Exchange JII Index 2016-2021, European Journal of Business and Management Research, 8 (5) pp.88–94. DOI: https://doi.org/10.24018/ejbmr.2023.8.5.2024
- Olayinka, A. A. (2022) Financial Statement Analysis as a Tool for Investment Decisions and Assessment of Companies’ Performance, International Journal of Financial, Accounting, and Management, 4 (1) pp.49–66. DOI: https://doi.org/10.35912/ijfam.v4i1.852
- Revsine, L., Collins, D. W. and Johnson, W. B. (2021) Financial reporting & analysis. (s.l.): McGraw-Hill. Available at: https://thuvienso.hoasen.edu.vn/handle/123456789/12878
- Sestino, A. and De Mauro, A. (2021) Leveraging Artificial Intelligence in Business: Implications, Applications and Methods, Technology Analysis & Strategic Management, 34 (1) pp.1–14. DOI: https://doi.org/10.1080/09537325.2021.1883583
- Stone, M., Aravopoulou, E., Ekinci, Y., Evans, G., Hobbs, M., Labib, A., Laughlin, P., Machtynger, J. and Machtynger, L. (2020) Artificial intelligence (AI) in strategic marketing decision-making: a research agenda. The Bottom Line, 33(2), pp.183-200.
- Strich, F., Mayer, A.-S. and Fiedler, M. (2021) What Do I Do in a World of Artificial Intelligence? Investigating the Impact of Substitutive Decision-Making AI Systems on Employees’ Professional Role Identity, Journal of the Association for Information Systems, 22 (2) pp.304–324. DOI: https://doi.org/10.17705/1jais.00663
- Yenni, Y., Arifin, A., Gunawan, E., Pakpahan, L. and Siregar, H. (2021) The impact of solvency and working capital on profitability. Journal of Industrial Engineering & Management Research, 2(4), pp.15-38. DOI: https://doi.org/10.7777/jiemar.v2i4.158
Online references
- Business Live (2022). Sage to acquire Seattle-based accounting firm in $2.3bn deal. Business Live. Available at: https://www.business-live.co.uk/technology/sage-acquire-seattle-based-accounting-24766298
- RELX (2023). Annual Report 2023. RELX. Available at: https://www.relx.com/~/media/Files/R/RELX-Group/documents/reports/annual-reports/relx-2023-annual-report.pdf
- RELX (n.d.). Home. RELX. Available at: https://www.relx.com/
- Sage (n.d.). Annual Report. Sage. Available at: https://www.sage.com/investors/financial-information/annual-report/.
- SAS (n.d.). Base SAS software. SAS. Available at: https://www.sas.com/it_it/software/base-sas.html
- SoluLab (n.d.). AI in Finance. SoluLab. Available at: https://www.solulab.com/ai-in-finance/
- The Strategy Institute (n.d.). A comprehensive guide to implementing the Balanced Scorecard framework. The Strategy Institute. Available at: https://www.thestrategyinstitute.org/insights/a-comprehensive-guide-to-implementing-the-balanced-scorecard-framework
APPENDIX
Financial statement (Sage group plc)
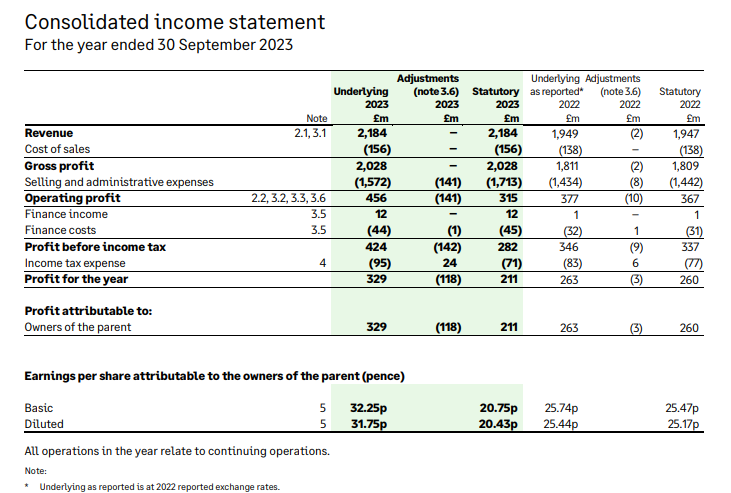
Source: Sage (n.d.) https://www.sage.com/investors/financial-information/annual-report/.
Financial statement (Relx plc)
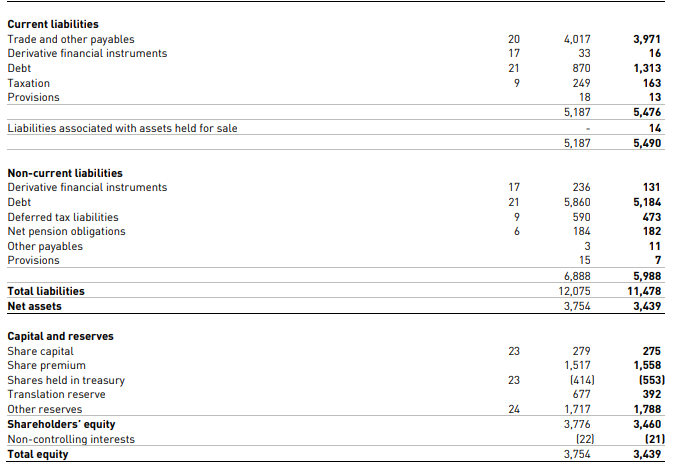
Source: RELX (2023) https://www.relx.com/~/media/Files/R/RELX-Group/documents/reports/annual-reports/relx-2023-annual-report.pdf
Financial ratios calculation
| Calculations | ||||
| in million | ||||
| Sage Group plc | Relx plc | |||
| Input data | 2022 | 2023 | 2022 | 2023 |
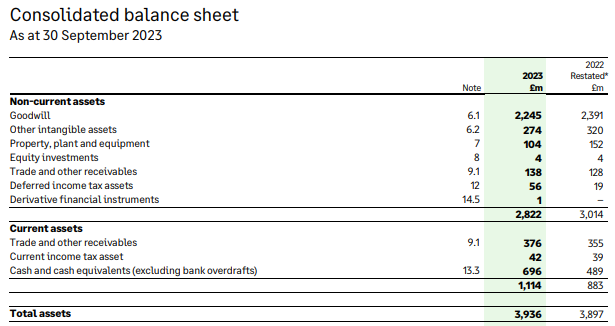
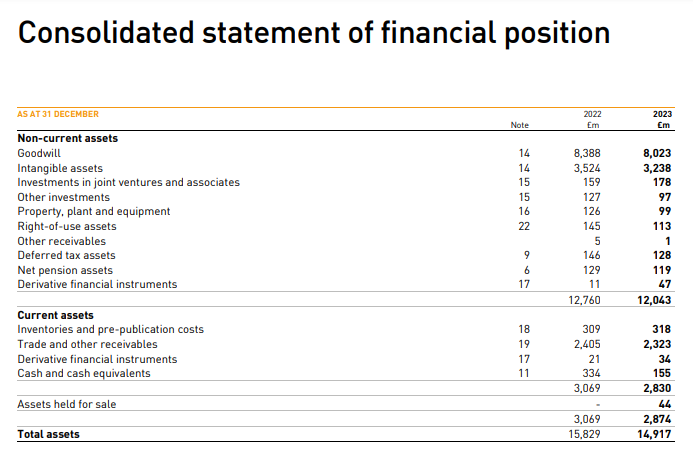
| Current assets | 883.00 | 1,114.00 | 3,069.00 | 2,874.00 |
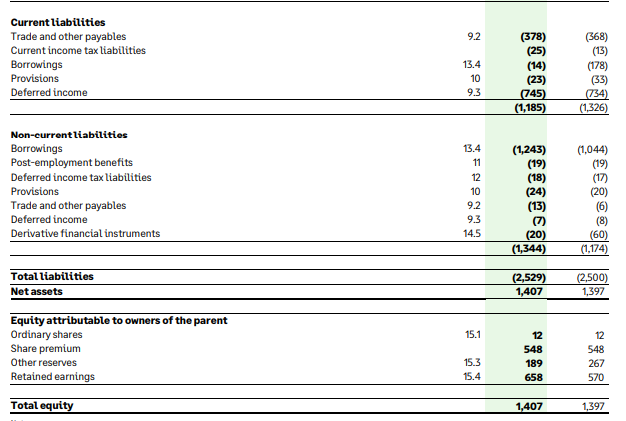
| Current liabilities | 1,326.00 | 1,185.00 | 5,187.00 | 5,490.00 |
| Cash and cash equivalent | 489.00 | 696.00 | 334.00 | 155.00 |
| Sage Group plc | Relx plc | |||
| 2022 | 2023 | 2022 | 2023 | |
| Liquidity ratios | ||||
| Current ratios | ||||
| Current assets / Current liabilities | 0.67 | 0.94 | 0.59 | 0.52 |
| Cash ratios | ||||
| Cash and cash equivalent / Current liabilities | 0.37 | 0.59 | 0.53 | 0.50 |
| Calculations | ||||
| in million | ||||
| Sage Group plc | Relx plc | |||
| Input data | 2022 | 2023 | 2022 | 2023 |
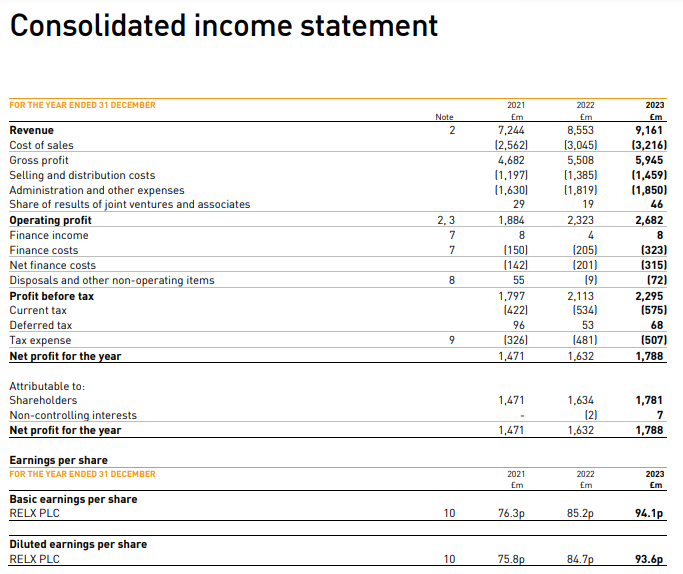
| Net income | 260.00 | 211.00 | 1,632.00 | 1,788.00 |
| Sales | 1,947.00 | 2,184.00 | 8,553.00 | 9,161.00 |
| Total assets | 3,897.00 | 3,936.00 | 15,829.00 | 14,917.00 |
| Sage Group plc | Relx plc | |||
| 2022 | 2023 | 2022 | 2023 | |
| Profitability ratios | ||||
| Net margin | ||||
| (Net income / Sales) | 13.35% | 9.66% | 19.08% | 19.52% |
| Return on assets | ||||
| (Net Income / Total Assets) | 6.67% | 5.36% | 10.31% | 11.99% |
| Calculations | ||||
| in million | ||||
| Sage Group plc | Relx plc | |||
| Input data | 2022 | 2023 | 2022 | 2023 |
| Debt | 2,500.00 | 2,529.00 | 12,075.00 | 11,478.00 |
| Equity | 1,397.00 | 1,407.00 | 3,754.00 | 3,439.00 |
| EBIT | 367.00 | 315.00 | 2,323.00 | 2,682.00 |
| Interest expense | 31.00 | 45.00 | 205.00 | 323.00 |
| Sage Group plc | Relx plc | |||
| 2022 | 2023 | 2022 | 2023 | |
| Leverage ratios | ||||
| Debt equity ratio | ||||
| (Debt / Equity) | 1.79 | 1.80 | 3.22 | 3.34 |
| Interest coverage ratio | ||||
| EBIT / Interest expenses | 11.84 | 7.00 | 11.33 | 8.30 |
| Calculations | ||||
| in million | ||||
| Sage Group plc | Relx plc | |||
| Input data | 2022 | 2023 | 2022 | 2023 |
| Accounts payables | £ 368.00 | £ 378.00 | £ 4,017.00 | £ 3,971.00 |
| COGS | £ 138.00 | £ 156.00 | £ 3,045.00 | £ 3,216.00 |
| Accounts receivables | £ 355.00 | £ 376.00 | £ 2,405.00 | £ 2,323.00 |
| Sales | £ 1,947.00 | £ 2,184.00 | £ 8,553.00 | £ 9,161.00 |
| Sage Group plc | Relx plc | |||
| 2022 | 2023 | 2022 | 2023 | |
| Working capital ratios | ||||
| Accounts payable days | ||||
| (Accounts payable / COGS) * 360 | 960.00 | 872.31 | 474.92 | 444.51 |
| Accounts receivable days | ||||
| (Accounts receivable / Sales) * 360 | 65.64 | 61.98 | 101.23 | 91.29 |
| Calculations | ||||
| in million | ||||
| Sage Group plc | Relx plc | |||
| Input data | 2022 | 2023 | 2022 | 2023 |
| Net profit to shareholders | £ 260.00 | £ 211.00 | £ 1,634.00 | £ 1,781.00 |
| Outstanding shares | 1020 | 1020 | 1919 | 1892 |
| Stock price | £ 690.40 | £ 990.60 | £ 27.79 | £ 39.04 |
| Sage Group plc | Relx plc | |||
| 2022 | 2023 | 2022 | 2023 | |
| Investor ratios | ||||
| Earnings Per Share (EPS) | ||||
| Net Income / Outstanding Shares | $ 0.25 | $ 0.21 | 0.85 | 0.94 |
| Price-to-Earnings (P/E) Ratio | ||||
| Stock Price / Earnings Per Share | 2708 | 4789 | 32.63 | 41.47 |
Balance scorecard
| STRATEGIC OBJECTIVES | KEY PERFORMANCE INDICATORS | TARGETS | INITIATIVES | |||||
| YEAR 1 | YEAR 2 | YEAR 3 | INITIATIVE | PROGRAMS | BUDGETS | |||
| FINANCIAL | 1. Enhance profitability and financial strength | Net Income, Return on Equity (ROE), Cost-to-Income Ratio, Shareholder Return | Net Income: $18.5B, ROE: 10%, Cost-to-Income Ratio: 50% | Net Income: $19.0B, ROE: 10.5%, Cost-to-Income Ratio: 48% | Net Income: $19.5B, ROE: 11%, Cost-to-Income Ratio: 47% | Digital Banking Expansion, Cost Optimization, Revenue Diversification | Efficiency Program, Digital Investments, Cost Reduction Initiatives | $1.2B for digital transformation, $300M for cost optimization |
| 2. Increase capital efficiency and risk-adjusted returns | Capital Adequacy Ratio, Risk-Adjusted Return on Capital | Capital Adequacy Ratio: 16%, RAROC: 10% | Capital Adequacy Ratio: 16.5%, RAROC: 11% | Capital Adequacy Ratio: 17%, RAROC: 12% | Risk management optimization, Portfolio Diversification | Risk Reduction Strategies, Credit Portfolio Management | $250M for risk management systems | |
| 3. Expand revenue streams from emerging markets | Revenue Growth in Emerging Markets, International Market Share | Emerging Market Revenue: 10% of total, Market Share: 5% | Emerging Market Revenue: 12% of total, Market Share: 6% | Emerging Market Revenue: 15% of total, Market Share: 7% | Geographic Expansion into Asia and Africa, Localized Products | Global Expansion Program, Market Entry Strategies | $300M for expansion into new markets | |
| CUSTOMER | 1. Improve customer satisfaction and loyalty | Customer Satisfaction Index, Net Promoter Score (NPS), Retention Rate | Satisfaction Index: 82%, NPS: +40, Retention: +2% | Satisfaction Index: 84%, NPS: +42, Retention: +3% | Satisfaction Index: 85%, NPS: +45, Retention: +4% | Personalization of Services, Enhanced Digital Engagement, Customer Feedback Channels | Customer Experience Improvement Program, Digital Channels Expansion | $100M for customer engagement, $50M for feedback systems |
| 2. Increase customer base in underserved segments | New Customer Acquisition, Market Penetration Rate, Diversity of Customer Base | New Acquisition: 5%, Market Penetration: 2% | New Acquisition: 6%, Market Penetration: 3% | New Acquisition: 7%, Market Penetration: 4% | Digital Banking Solutions, Financial Inclusion Initiatives | Financial Inclusion Program, Targeted Marketing Campaigns | $150M for digital solutions, $80M for marketing campaigns | |
| 3. Strengthen customer relationships with personalized services | Customer Retention, Customer Lifetime Value (CLV) | CLV: $50,000, Retention: 75% | CLV: $55,000, Retention: 78% | CLV: $60,000, Retention: 80% | Personalized Financial Advisory, AI-powered Insights | Customer Relationship Management Program, AI and Data Analytics | $200M for personalized services, $50M for AI systems | |
| INTERNAL PROCESSES | 1. Increase operational efficiency and streamline processes | Operational Cost Reduction, Time-to-Market for Products, Process Automation Level | Operational Cost Reduction: 3%, Product Time-to-Market: 5 months, Process Automation: 50% | Operational Cost Reduction: 4%, Product Time-to-Market: 4 months, Process Automation: 55% | Operational Cost Reduction: 5%, Product Time-to-Market: 3 months, Process Automation: 60% | Operational Streamlining, AI and Machine Learning Integration, Agile Practices | Process Optimization Program, AI Integration, Digital Transformation | $500M for automation, $200M for AI systems |
| 2. Enhance compliance and regulatory adherence | Regulatory Compliance Rate, Audit Results, Risk Management Score | Compliance Rate: 98%, Audit Results: Pass | Compliance Rate: 99%, Audit Results: Pass | Compliance Rate: 99.5%, Audit Results: Pass | Regulatory Training, Risk Management Systems | Regulatory Compliance Program, Internal Audits | $100M for compliance systems, $50M for training | |
| 3. Improve product innovation and development | Product Launch Time, Number of New Products, Innovation Index | Product Launch Time: 5 months, New Products: 10 per year | Product Launch Time: 4 months, New Products: 12 per year | Product Launch Time: 3 months, New Products: 15 per year | Agile Development Process, Cross-Department Collaboration | Product Development Program, Innovation Labs | $150M for R&D, $50M for innovation labs | |
| LEARNING | 1. Foster employee innovation, learning, and leadership | Employee Training Hours, R&D Investment, Employee Engagement, Leadership Development | Training: 20 hours/employee, R&D Investment: 3% of Revenue, Engagement: 75%, Leadership Training: 100 participants | Training: 22 hours/employee, R&D Investment: 3.5% of Revenue, Engagement: 78%, Leadership Training: 120 participants | Training: 25 hours/employee, R&D Investment: 4% of Revenue, Engagement: 80%, Leadership Training: 150 participants | Skill Development Programs, Innovation Hubs, Leadership Development Initiatives | Employee Engagement and Learning Programs, R&D Investments, Leadership Programs | $200M for employee development, $400M for R&D initiatives |
| 2. Enhance leadership capabilities across all levels | Leadership Engagement, Employee Satisfaction with Leadership, Leadership Training Completion Rate | Leadership Engagement: 85%, Satisfaction: 80%, Training: 90% completion | Leadership Engagement: 88%, Satisfaction: 82%, Training: 92% completion | Leadership Engagement: 90%, Satisfaction: 85%, Training: 95% completion | Leadership Training Programs, Succession Planning | Leadership Development Program, Succession Planning | $50M for leadership development, $30M for succession planning | |
| 3. Promote diversity and inclusion within the workforce | Diversity Ratio, Gender Equality Index, Inclusion Survey Scores | Diversity Ratio: 40%, Gender Equality Index: 85% | Diversity Ratio: 45%, Gender Equality Index: 90% | Diversity Ratio: 50%, Gender Equality Index: 95% | Inclusion Initiatives, Diversity Hiring Practices | Diversity and Inclusion Program, Equal Opportunity Hiring | $60M for inclusion programs, $40M for diversity hiring | |
| 4. Improve employee well-being and work-life balance | Employee Well-Being Index, Work-Life Balance Satisfaction, Employee Retention | Well-Being Index: 75%, Satisfaction: 80%, Retention: 85% | Well-Being Index: 78%, Satisfaction: 82%, Retention: 88% | Well-Being Index: 80%, Satisfaction: 85%, Retention: 90% | Wellness Programs, Flexible Work Arrangements | Employee Well-Being Program, Health and Wellness Initiatives | $50M for wellness programs, $25M for work-life initiatives | |

UPTO56%
Avail The Benefit Today!
To View this & another 50000+ free