Business intelligence is the new secret to the growth of any business. Thus, keeping track of data and analyzing profits or losses for strategy development is crucial for any type of business. Therefore, to analyze, collect, and present information, companies use two major analytical tools, which are Power BI and Tableau. In this blog, we are going to cover all the major points related to these tools, including features, similarities, pros and cons, and the difference between Power BI and Tableau.
Find Your Perfect Power BI ExpertWhat Is Power BI?
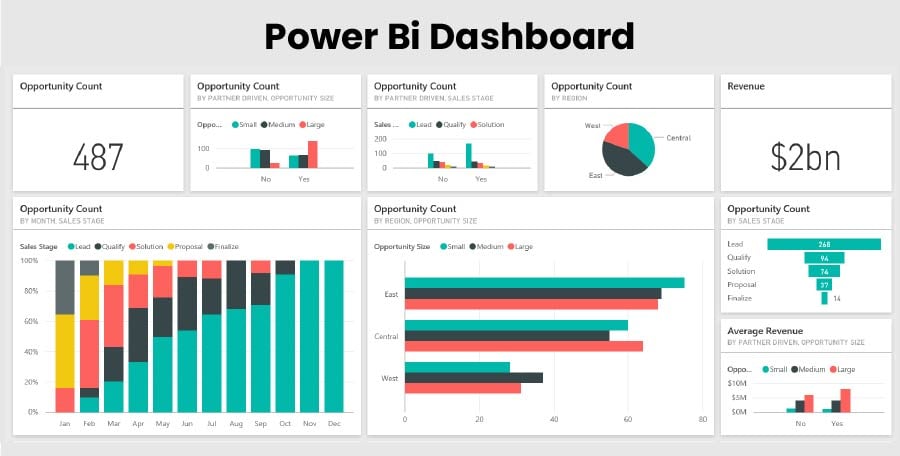
Microsoft Power Business Intelligence is a business analytic tool. It is used in creating interactive visualizations with self-service business intelligence capabilities. Moreover, it is used to do tasks such as creating reports and dashboards without the use of other technology.
What Is Tableau?
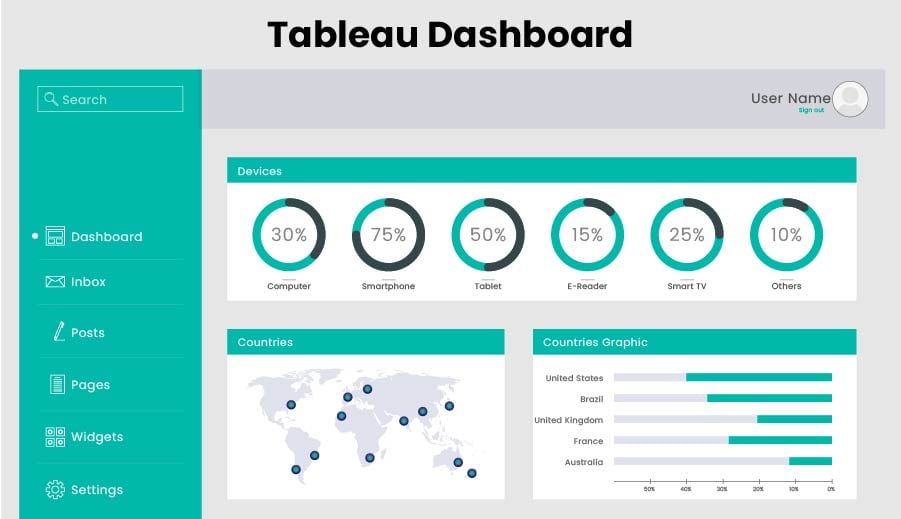
Tableau business intelligence is a data visualization tool that is used for analyzing data. It organizes large sets of data into one. Moreover, it provides an easy-to-use and interactive interface for powerful data visualizations that are easy to understand, which makes the analysis and sharing process easier.
Key Feature of Power BI and Tableau
In this section, we are going to discuss the features provided by both of these tools. Both the tools, whether it is Power BI or Tableau, both of them have some common features and some differences, so let's discuss them.
Feature of Power BI
Power BI is a business analytics tool that can be used for various purposes such as analyzing, visualizing, and sharing data. So, here are a few key features of Power BI:
Data Visualisations: It offers a variety of visualization methods such as bar charts, line graphs, pie charts, and maps.
Data Exploration: It allows users to get information quickly by providing features such as data points, filtering data, and creating hierarchies.
Data Modelling: It is easier to create and manage relationships between data sources, define calculations, and develop measures and KPIs.
Data Transformation: Its easy accessibility to collaborate with other Microsoft tools allows easy sharing of reports and dashboards.
Mobile Access: The mobile app of Power BI allows you to keep track of your data using your phone.
Natural Language Processing: It has natural language processing features that allow users to ask questions in their natural language and answer through visualizations.
Real-Time Data: Power BI's ability to connect with real-time data sources can allow users to display real-time data in visualizations.
Features of Tableau
Tableau business intelligence is a strong data visualization and business intelligence tool that offers numerous features to help users analyze, visualize, and share data. Here are a few key features of Tableau:
Data Visualization: Tableau allows a variety of data visualization such as bar charts, line charts, scatter plots, maps, and many more. Moreover, the interactive dashboards and visualizations make Tableau an easy-to-use tool for exploring data and gaining insights.
Data Exploration: Tableau offers its users the ability to explore data in depth by drilling down into complex data, filtering data, and creating hierarchies.
Data Modelling: The easy-to-use feature for creating and managing relationships between different data sources, defining calculations, and creating measures and KPIs.
Data Preparation: Tableau involves a data preparation feature that enables users to structure and filter data for analysis.
Collaboration: Tableau enables users to collaborate and share reports and dashboards with colleagues and integrate with other tools like Slack, Salesforce, and Google Drive.
Mobile Access: The Tableau mobile app allows users to access reports and dashboards easily on their phones.
Natural Language Processing: The natural language processing feature of Tableau allows its users to ask questions in natural language and receive answers in the form of visualizations.
Real-Time Data: The ability of Tableau to connect with real-time data sources such as Amazon Kinesis, Apache Kafka, and Tableau Server extracts allows it to display real-time data visualizations.
Tableau vs. Power BI: Pros and Cons
After discussing the features of both tools, it's time to discuss the pros and cons of Power BI and Tableau. So, let's begin.
Advantages and Disadvantages of Power BI
So, let's first begin by discussing the advantages and disadvantages of Power BI.
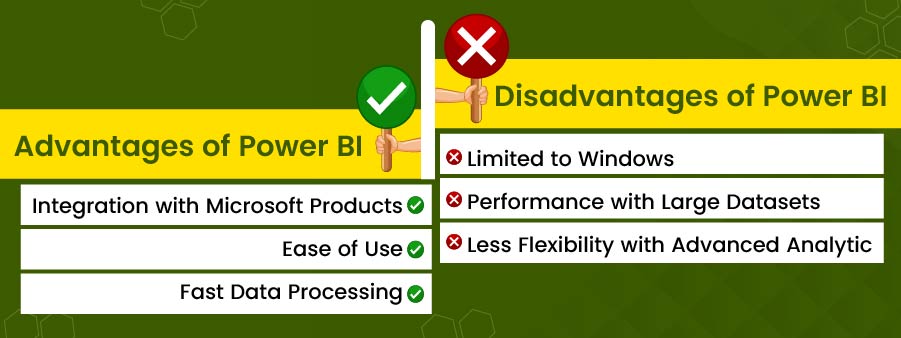
Power BI Advantages:
Integration with Microsoft Products: Power BI's parent software is Microsoft, so it can easily integrate with other Microsoft products such as Excel, SharePoint, and SQL Server.
Ease of Use: The easy-to-use and interactive interface of Power BI makes it a user-friendly tool. This allows users to create reports and dashboards without needing high technical knowledge.
Fast Data Processing: Power BI handles large amounts of data and has a fast processor, which helps users to get insights quickly from their data.
Affordable: Power BI is affordable for new start-ups. Moreover, it involves free options and low-cost subscription plans for small businesses.
Limited Customisation Options: Power BI has a wide range of customization options, but it may have less flexibility and customization than Tableau.
Limited Data Connectivity: Power BI connects only with a few data sources, which can be a disadvantage if you work with data from multiple sources.
Dependence on Microsoft Products: Since it is a Microsoft product, you might have to use other Microsoft products to utilize its features fully.
Power BI Disadvantages:
Limited to Windows: Power BI is only limited to Windows; it does not support Mac OS, which can be an issue for Mac users.
Performance with Large Datasets: Users might face issues with performance while working on large data sets.
Less Flexibility with Advanced Analytics: Not as smooth as Tableau in handling challenging data analytics.
Advantages and Disadvantages of Tableau
After covering the advantages and disadvantages of Power BI, let's cover the pros and cons of Tableau.
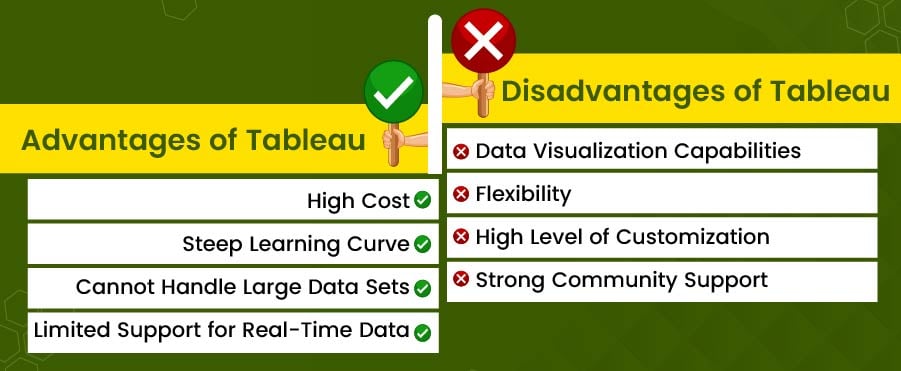
Advantages of Tableau
Data Visualization Capabilities: Tableau has great advanced data presentation features. It offers a variety of charts, graphs, and other visualization options, making it easy to explore and communicate data.
Flexibility: Unlike Power BI, Tableau can integrate with a wide range of data sources, such as Hadoop, DB tech, SAP, and BigQuery, including cloud-based programs.
High Level of Customization: Tableau's ability to customize the appearance and functionality of their reports and dashboards to fit their requirements.
Strong Community Support: Tableau has a large and supportive community of users who can guide you, and share tips, and best practices, making it easier to get help and learn from others.
Disadvantages of Tableau
High Cost: Tableau is an expensive tool, which can be a disadvantage for large firms that need multiple licenses or access to more advanced features.
Steep Learning Curve: Tableau is more complex to learn if compared to Power BI, especially for those who have no technical knowledge.
Cannot Handle Large Data Sets: Tableau is a fast tool, but it may have performance issues while working with large data sets or complex calculations.
Limited Support for Real-Time Data: Tableau is capable of displaying real-time data, but it might not be as effective as other tools designed specifically for real-time data processing.
Differences Between Power BI and Tableau
After discussing the pros and cons of Power BI and Tableau, it's time to shift to the compare and see the differences between Tableau and Power BI:
Power BI vs. Tableau: Price
Tableau and Power BI are both strong business intelligence tools. They offer different features with different subscription plans. So, let's discuss Power BI first:
Power BI: Let's first begin with Power BI. It has three plans that have different features with distinct pricing.
Power BI Basic: The basic plan is free for everyone. Here are some key features it includes access to:
- Data connection services
- Power BI Desktop
- Content Collaboration
It is suitable for basic data analysis and reporting.
Power BI Pro(9.99 $ per month): It covers all the features of the basic plan. Moreover, it involves features such as:
- Power BI service
- Content packs
- It enables data flow
- Access to the mobile app
Power BI Premium($4,995 per capacity per month): It is best suitable for large firms, it covers features such as:
- All the features of the basic and pro plan
- Large scale deployment
- Powerful processing for analyzing large data sets
Power BI Embedded: It does not have a fixed monthly price, it costs $1 per hour depending on the virtual core and memory. The major feature of this plan is it allows users to embed Power BI visuals into their applications. Plus, all the features of basic, pro, and premium.
After knowing the different plans offered by Power BI, you might think is power bi better than tableau? But lets not judge it, first see what Tableau offers.
Tableau: It offers four main subscription plans which are:
Tableau Viewer($15 per user per month): This plan is designed for those who need access to the Tableau server but do not want to create dashboards. It only gives access to:
- Tableau server
- Tableau online
Plus, it covers all the free tableau features.
Tableau Explorer($42 per user per month): This plan is suitable for advanced business analyzers who need advanced features for analysis. It involves:
- Full Tableau product suite
- Access to Tableau server
- Access to Tableau online
- Access to Tableau Prep Builder
Tableau Creator($70 per user per month): It is a plan for small businesses, it involves features such as:
- Powerful analytics and visualization capabilities
- Access to Tableau Desktop and Tableau Prep Builder Tools
Tableau Server: The cost of this server depends on the number of users and other factors. This plan is designed for larger firms, It covers all the products such as:
- Tableau Desktop
- Tableau Server
- Tableau Online
- Tableau Prep Builder
To get this plan you have to contact the Tableau team and ask them “how much does tableau cost?” for the server..
Hire Power BI Experts!Power BI vs Tableau: Performance
Performance is one of the most essential aspects to consider when choosing a BI tool. Poor performance can lead to losses, missed deadlines, and errors that can affect the process of decision-making. So, let's compare and learn about the performance of both Power BI and Tableau:
Tableau: Tableau is very famous for its fast performance, so here are a few insights into Tableau's performance:
- Tableau can process and visualize large sets of data quickly and efficiently, which allows its users to gain insights and analyze data.
- It is developed in such a way that it performs well while analyzing data and analytics. Moreover, the fast features, such as memory query processing and analytical processing, speed up the process of data analysis.
- Its capabilities enable users to analyze large data sets. This feature of Tableau allows users to quickly analyze data and provide insights.
Power BI: Power BI is known for its robust performance, allowing its users to analyze large amounts of data quickly and efficiently. Here are some key features that make it different from others.
- Power BI's performance depends on the size of the data sets and the complexity of the data set. If you run large and complex data sets, the performance can be not as satisfying. However, with the smaller data sets, it is very fast and efficient.
- In addition, it offers the user a variety of features for data visualization that can help in improving its performance.
The feature of memory caching improves the query response times.
Power BI vs. Tableau: User Interface
A well-designed user interface makes a tool easy to use for the readers and helps them understand the data easily. If a tool is very complex to use, users may quickly switch and use another tool. Moreover, a simpler user interface can be easy to use and intuitive for the readers to explore and engage with the data.
Tableau:
- The user interface of Tableau makes it easier for the user to analyze data from multiple sources.
- It provides a drag-and-drop interface, which makes it easier for the user to create a visualization without the need for any coding.
- Tableau offers data blending, enabling users to combine data sets from other sources for a larger visualization.
- The easy-to-use interface of Tableau allows the users to understand and navigate to all the tools and features.
- The visualization features are available, and it provides various forms of graphs, such as bar line, scatter, pie, and tree maps.
Power BI:
- Power BI is developed in such a way that enables users to analyze data.
- The different tabs of Power BI make it easier for navigation.
- The UI of Power BI also involves features such as drag and drop that allow a user to create new visualizations.
In addition, it involves a simple search bar that enables users to find the data they need for their reports and dashboards.
Power BI vs. Tableau: Community Support
Community support is crucial for the development of a tool. It allows users to give feedback and suggestions, which are essential for improvement. So, let's discuss the community support of both Tableau and Power BI.
Tableau: Tableau has a thriving community of users and supports. Here are a few stats:
- It has over 3 million users. In addition, it has more than 60,000 firms.
- It has one of the largest and most active communities of users.
Power BI: Power BI has always been improved by the community; here are a few stats:
- It has around 10 million monthly active users.
It has a large community of online users with over 1.2 million members on the Power BI community forum.
Power BI vs. Tableau: Security
Security is an aspect that is vital because large firms or any business want protection against data manipulation. Be it Power BI or Tableau, both of the tools have prioritized the security of data. Here are a few common features provided by both of them.
Data Encryption: They use industry-based encryption algorithms to protect customer data.
Role-Based Access Control: They both involve the feature of setting up user roles and allow them specific permissions.
Multi-Factor Authentication: They have multi-based authentication that is supported for extra security.
Granular Permissions: It is used for the users to access the data they need. It ensures the security of confidential data.
Data Masking: Confidential data can be masked so that users only have access to what they want, which helps in protecting against unauthorized access.
Overall, both Power BI and Tableau provide strong security features so users can be safe using their tools.
Power BI vs. Tableau: Data Visualization Options
Visualizations are the most crucial element of BI tools; they allow users to analyze and understand data from large sets of data.
Tableau: As we know, it is a strong visualization tool. It offers various visualization styles such as:
- Bar charts
- Line charts
- Area charts
- Pie charts
- Scatter plots
- Heat maps
- Tree maps
- Box and Whisker plots
- Gantt charts
- Histograms
- Bullet graph
- Donut charts
- Waterfall charts
- Funnel Charts
- Motion Charts
- Word clouds
- Pareto charts
Power BI: It offers a variety of visualization options which allows users to create complex, interactive visualizations from data. Here are a options it provides:
- Column charts
- Line charts
- Area charts
- Maps
- Filled maps
- ArcGIS maps
- Treemaps
- Sunburst
- Funnel charts
- Network Graphs
- Sankey Diagrams
Tableau and Power BI are both great for data visualization; both have their own weaknesses and strengths.
Power BI vs. Tableau: Sharing
The sharing of dashboards and reports is a crucial component of a BI tool.
Tableau: It's complex to share resources in Tableau. It includes features that allow you to share data. However, this feature is tough to use, as the users cannot embed reports into webpages or apps. Moreover, to share dashboards and workbooks, you will have to publish them on Tableau Server, Tableau Online, or Tableau Public.
Power BI: It allows you to share data and reports within seconds. It allows you to access the cloud securely. Moreover, it enables users to embed reports into web pages or apps.
Power BI vs. Tableau: Products
Power BI and Tableau both offer several products that are used for data visualizations and analysis. So, here are the main products of both:
Tableau Products:
Tableau Desktop: It is the main product for creating data visualizations and dashboards.
Tableau Prep: It is used for preparing and cleaning data before analysis.
Tableau Server: It enables users to share their data securely.
Tableau Online: It is a cloud-based alternative to Tableau Server.
Tableau Mobile: The mobile app of Tableau allows users to access their content on mobile devices.
Tableau Public: It is a free platform for users to create and share visualizations.
After discussing the products of Tableau, it's time to move to Power BI:
Power BI Products:
Power BI Desktop: It is the main product for creating data visualization.
Power BI Service: It is the cloud-based platform that allows users to share data and dashboards using internet.
Power BI Mobile: It allows users to access data on mobile phones.
Power BI Embedded: It enables users to embed visualizations and reports into other applications.
Power BI Report Server: It enables users to create, publish, and keep the record of Power BI reports on their own servers.
So, this blog was your guide to choose between the two of the best business intelligence tools. The battle of these tools was equal throughout the write-up. But still confused about which is better tableau or power bi?. So, the answer is it depends on your requirements and needs. Both of the business intelligence tools cover all the major features that are required for analyzing and data visualization and have their own disadvantages. Both robust tools have a variety of features to offer you, so analyze the above write-up and identify which one suits you the most. However, if you still want to get more clarity with Power BI examples, so you can read our another blog Power BI Dashboard Examples. Moreover, if you want to polish your skills and knowledge in one of the tools, then try seeking help from us. Want to know how? Read the next section.
Get Power BI Assignment Help!Need Help with Power BI? Try Us!
Hopefully, this comparison of Power BI vs. Tableau cleared the air for you. Power BI is the future of business intelligence. The demand for Power BI has reached a whole new level. A study says that by 2025, the future of business relies on BI tools such as Power BI, so it is crucial for students to focus on excelling in this subject. But how can you get better at using Power BI? Do not worry! We at Global Assignment Help have experts who have experience of using Power BI. They can help you in finishing your Power BI assignments, javascript assignment help and solving your doubts related to it. Moreover, they can clear you doubts such as “tableau or power bi which is better for career growth?” So, what are you waiting for? Contact now.
Free Tools

Easy to Use Paraphrasing Tool to Simplify Complex Academic Writing
Check Now
Get Structured Outline by Professionals for Your Dissertation
Check Now
Effortlessly manage citations and references with our smart referencing tool
Check NowPrice Calculator
- Plagiarism
- Pricing
- Order Now
- Call Back
- Live Chat

Limited Time Offer
Exclusive Library Membership + Free 300$ Wallet Balance

Get $300 Now
Update your Number













Thank you for submitting your comment on this blog. It is under approval. We will carefully review your submission and post it on the website.