Top 15 Power BI Examples of Dashboards | UPDATED
15 Jan 2025 1064 14 minutes
Power BI is a growing data analytics tool in today's world. It helps analytics manage their data effectively without any hassle. Moreover, it is a tool that turns your raw data into insightful ones. It has several types of dashboards for this purpose. You can personalize one to manage your data. But, for that you need to have a look at this blog, where we will be discussing 15 such power BI examples of dashboards that can help you understand it in a better manner.
Best Features of Power BI Dashboards
You must be wondering that what makes power BI dashboard the best for students or people in data analytics, right? Well, there are many features of it that makes it reliable and effective to use. It has been helping people for managing data effectively since years. It has transformed the data managing techniques and is replacing excel as one of the most used data analysis and visualization solutions tool. Therefore, you must look at some of its features mentioned below to know more about it.
- Power BI dashboardsare audience specific and is different for all kind of audiences. Be it business or marketing, everyone can use it.
- The Power BI dashboard has perfectly matched the aesthetics by using colors creatively to engage their audience.
- Load time matters the most when it comes to digital tools. The fast processing makes it more handy and effective for the users.
- Power BI project has a grid layout that helps the audience to be more productive and also enables them to follow a seamless process.
The above features must have helped you understand why people rely on dashboards to manage their data. It is an effective way to make your task easier through applications of MATLAB and using dashboards. Thus, you must look at some of its examples in the following examples to get a clear view of it.
15 Effective Examples of Power BI Dashboard
In this section, you will explore a list of 15 power BI dashboard examples. All of them are crucial to learn about and are made to make data management an easy task. Therefore, you must go through the following list to understand about each of them.
1. E-Commerce Sales Dashboards
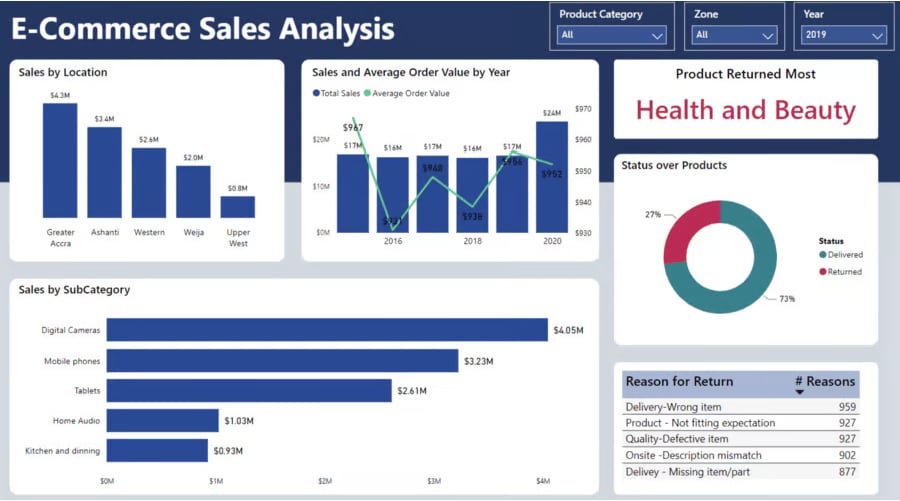
The E-commerce sales dashboard is designed for online retailers' data analysis and visualization techniques. It helps them by providing a high level of understanding about how the products perform in the market. Moreover, it provides them with different data based on yearly, monthly and weekly basis. It is an effective way for retailers to keep track of the products and services currently being sold and their growth rates through this dashboard by Microsoft Power BI.
2. NCAA Football Financial Dashboard
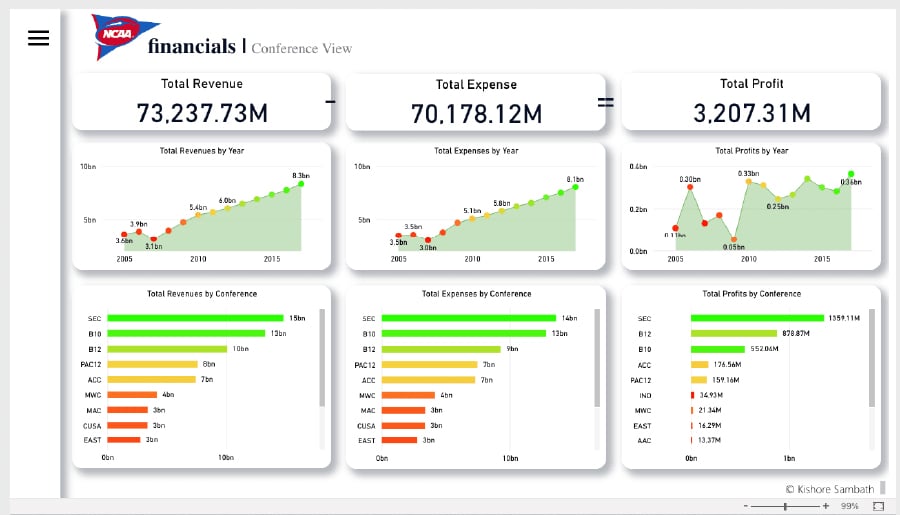
NCAA is an acronym that stands for National Collegiate Athletic Association. It is an organization that manages the athletes in United Nations and Canada. So, this power BI project basically covers the financial performance of NCCA athletes. It includes total expenses, revenue, and profits. Moreover, with this dashboard audience can easily filter out the data by conference and by participating school.
3. Web Analytics Dashboard in Power BI
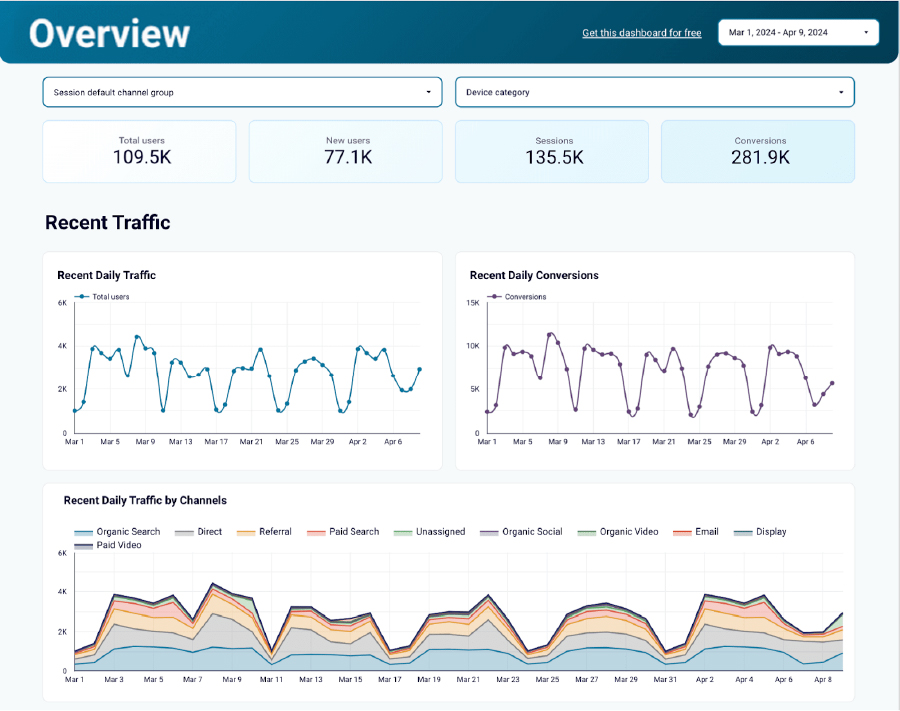
Web analytics Power BI dashboard provides you with an overview of traffic generated by your website. It highlights the performance and provides you with an overview by generating data from Google Analytics. It is a tool that can help you get an idea of how people are interacting with your website. It includes traffic, page views, bounce rates, and most visited pages. So, if you are into digital marketing and search engine optimization, it can be an effective tool for you to keep track of power BI tool in real-world situations.
4. SEO Dashboard in Power BI
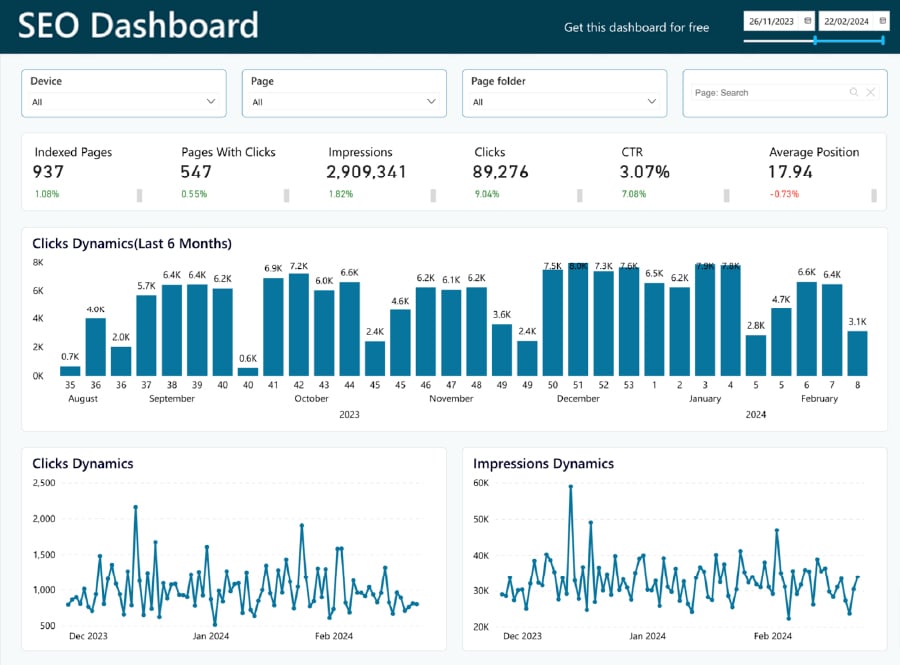
Next is somewhat similar to the above; it is known as a search engine optimization dashboard that can be helpful for your Power BI projects for resume as well. It helps you analyse the SEO based performance through the data from google search console. This dashboard includes various visuals that helps the user understand how SEO metrics have changes and what are the results. With this you can keep a track of top pages and about their clicks or impressions, worst performing pages and more. It is practical to engage more audience by making timely updates on your website through real-time dashboards.
5. Google Ads Dashboard in Power BI
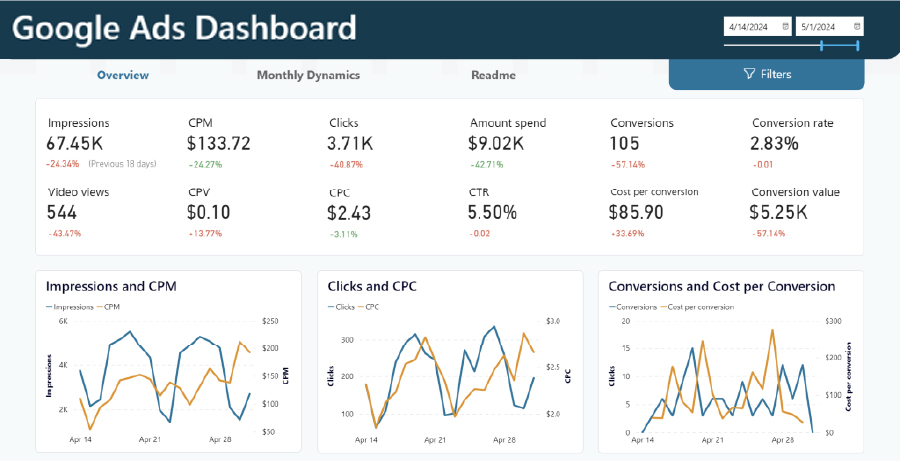
Another crucial dashboard for digital marketers is known as Google Ads dashboard, it has stunning power bi dashboard designs. With this, you can monitor the KPIs for evaluating the growth and success of your campaign. Moreover, you can also enhance the performance by making slight changes based on the results. This dashboard helps you to keep your ad spends under your control to drive conversions for analyzing real-time company performance.
6. Revenue Dashboard for Quick Books in Power BI
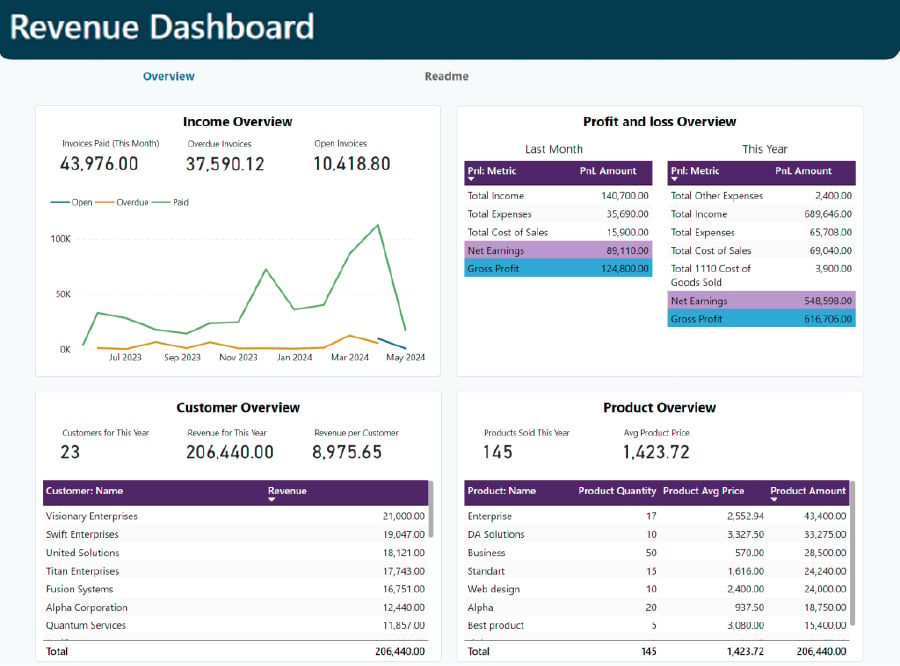
Next is known as revenue power BI dashboard for quickbooks is a financial dashboard. It extract the data from quick book account and visualize it with an analysis graphs. It offers you with user-friendly report that makes it handy for analysing the data. It provides you with a concise brief about the income dynamics, including profit and loss breakdown. Moreover, it can also be used to analyse invoices by filtering them according to date, status, and customer.
7. Sales Lead Overview Dashboard in Power BI
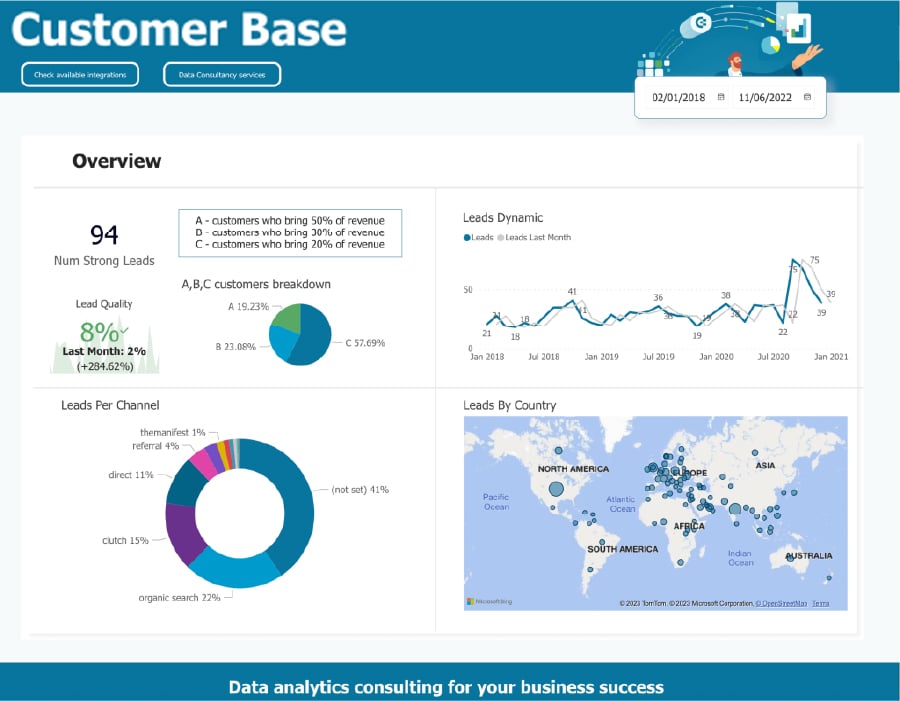
Another crucial dashboard is known as sales lead overview, it an effective tool for the sales teams. It allows you to explore the base of your customer and gain results for improving it. Moreover, it helps you to track the lead and know where is it coming from. You can track dynamics for managing sales efforts and making accurate predictions as well just like other power BI dashboard samples.
8. Global Energy Trade Analysis
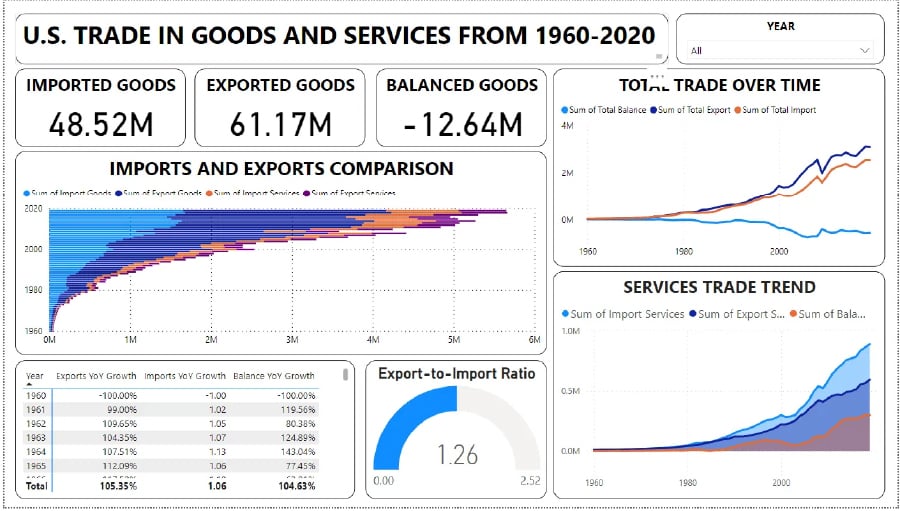
Global energy trade is one of the creative power bi dashboard examples and unique dashboards in Power BI, as it deals with the topic of global energy resources and related topics. This dashboard deals with topics like wind energy, water energy, and more. Also, it addresses its consumption on different scales based on national economies. Here, you can explore questions like which country is the leading producer and consumer of specific energy resource. Moreover, you can also get Matlab assignment help from us.
9. Adventure Works Database Analysis
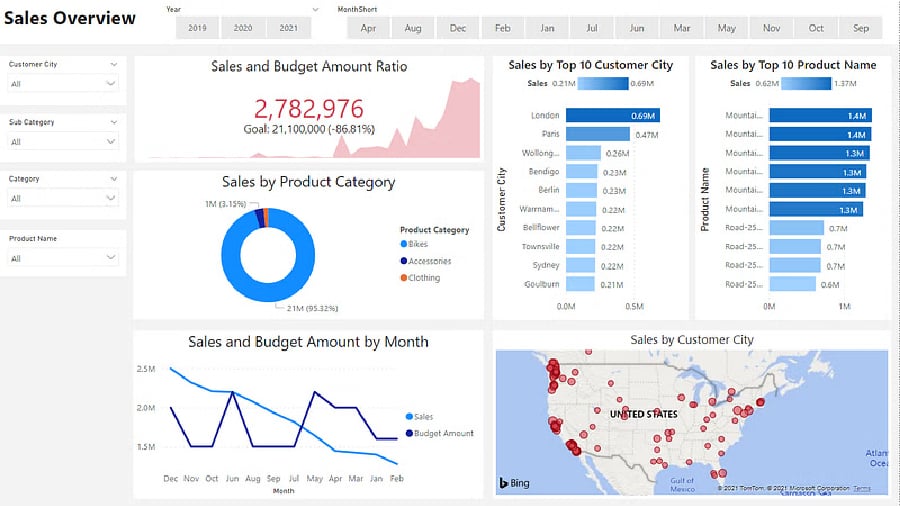
Adventure works database is an effective business intelligence and data dashboards for analyzing business data to uncover the insights about the sales and performance of products. Moreover, it is an effective tool for analysing the behavior of customers and the growth of any product. You can easily analyse data about which category of product is making more revenue and also analyse on the basis on the regions in power BI dashboard samples. Moreover, you can also get data on seasonal patterns and their impact on the demand for specific products.
10. POC EID Data Dashboard
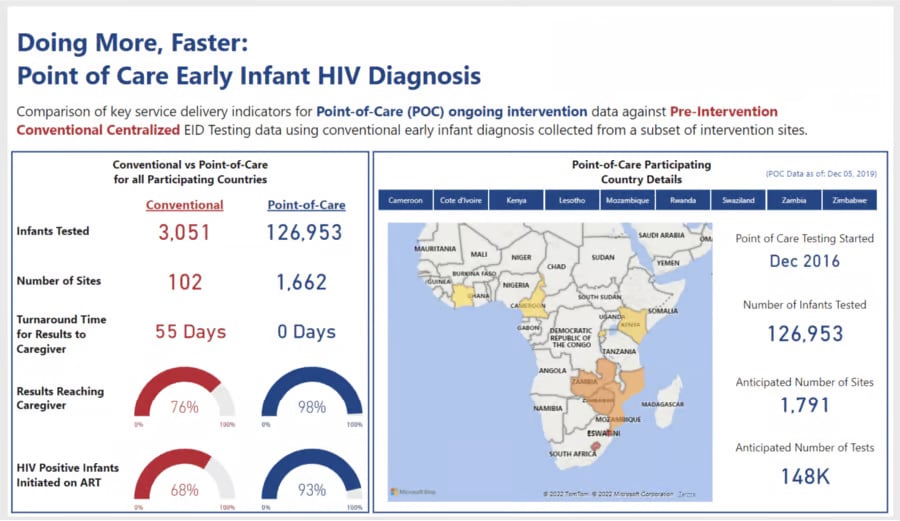
The Point-of-Care Early Infant Diagnosis (POC EID) is a crucial power BI dashboards that evaluates the impact of POC on early HIV diagnosis among infants. You can use this power bi projects for practice have been carried out in nine African states that are Cameroon, Rwanda, Eswatini, Zambia, Côte d'Ivoire, Kenya, Lesotho, Mozambique, and Zimbabwe. Moreover, this project also provides an overview of POC care testing when compared to the conventional methods used by doctors.
11. Supermarket Sales Dashboard
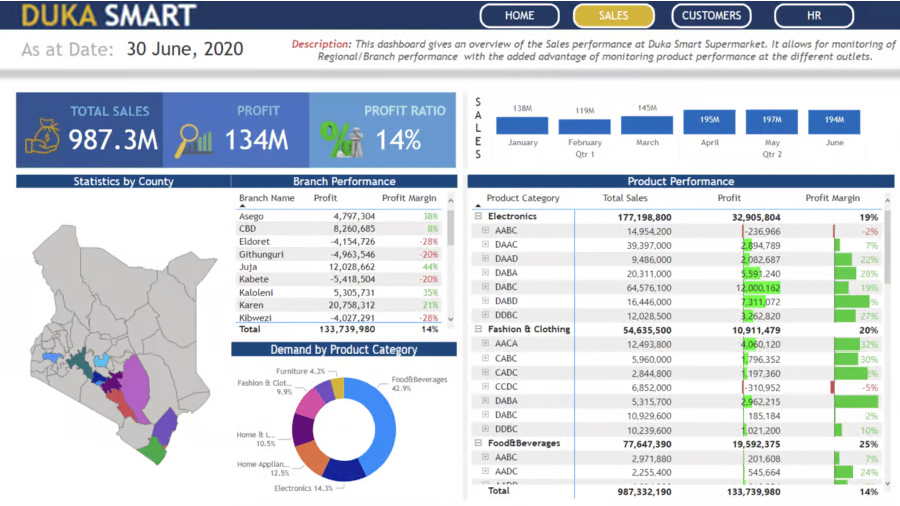
Supermarket sales power BI project is a concise dashboard that helps you to take a glance at the financial performance about a supermarket chain. It helps the user with three reports that covers all the data about sales. It breaks the data into the category of product, customer demographic, and the headcount data across different branches of supermarkets.
12. Sales Dashboard in Power BI
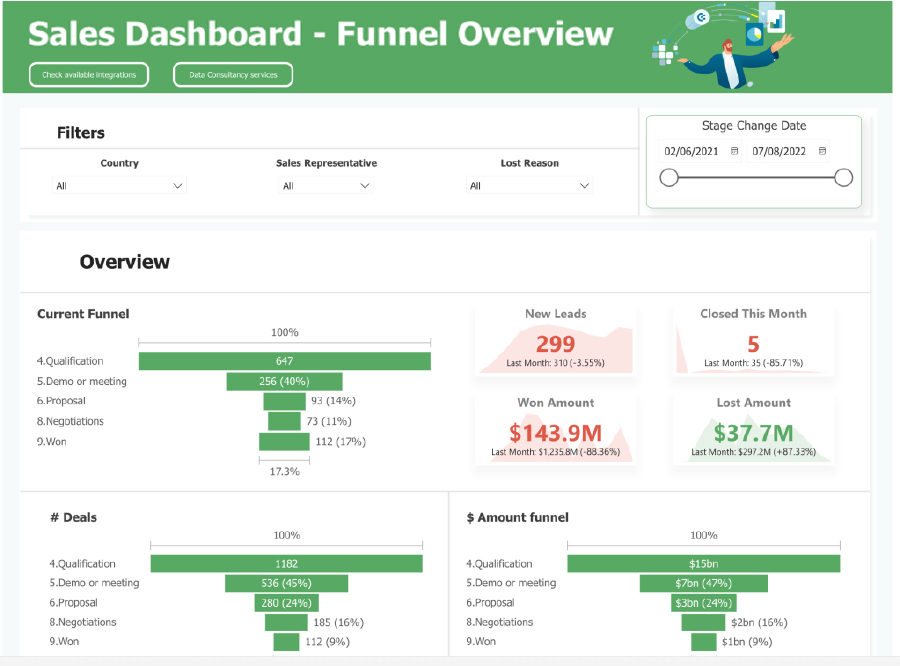
Sales power BI dashboard design provides a comprehensive overview of the sales that have taken place and the achieved results. It provides interactive funnel charts for visual representation of the data and how leads transforms into profit deals. It walks through the stages of the funnel data. In this, you can also define each region based on a geographic basis. Moreover, you can also use data analysis in Power BI to analyze the reasons behind the lost deals based on different regions.
13. KPI Dashboard in Power BI
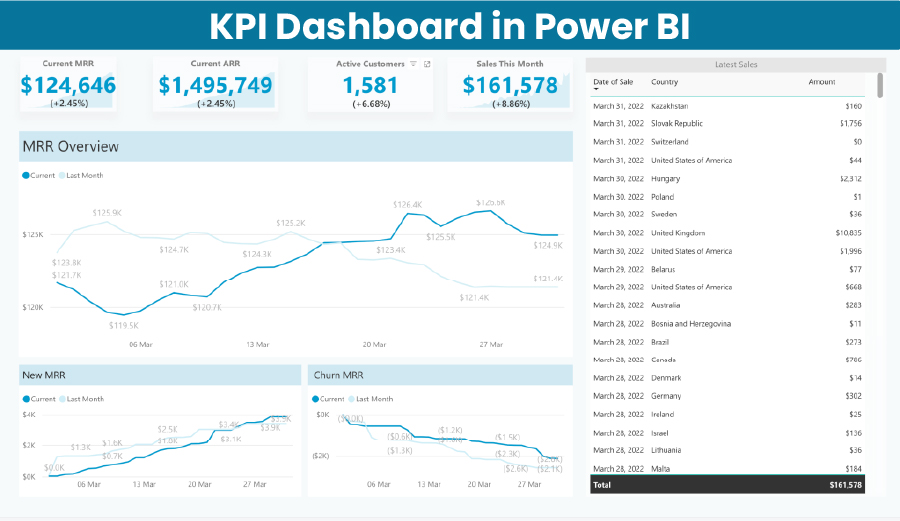
KPI is focused on solving data management problems that only cover the leading business in KPI, which stands for key performance indicators. The visualization of data in this dashboard shows the current value of MRR and automate KPIs with significant metrics that bring out the total for the current month. You can also track changes throughout the period of time and make comparisons. It is a significant power BI projects for sales and marketing professionals.
14. Power BI Operations Dashboard
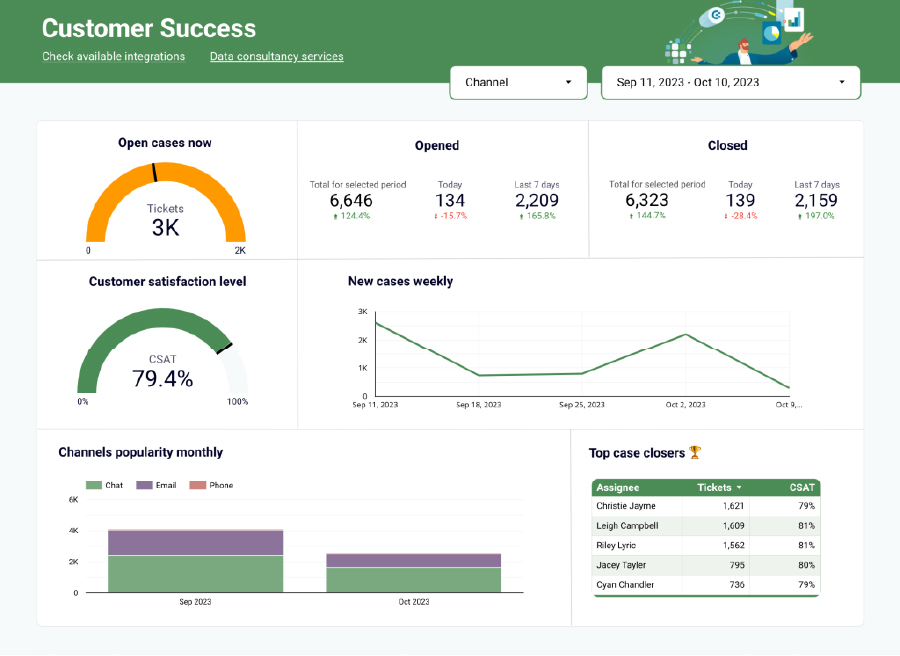
Power BI operational dashboard is a detailed dashboard that informs the user about day-to-day operations of customer support department. It is an effective way to monitor the status of ongoing activities for stakeholders. Moreover, it can also be tailored as a visualization tool from other departments also.
15. OTT Media Dashboard
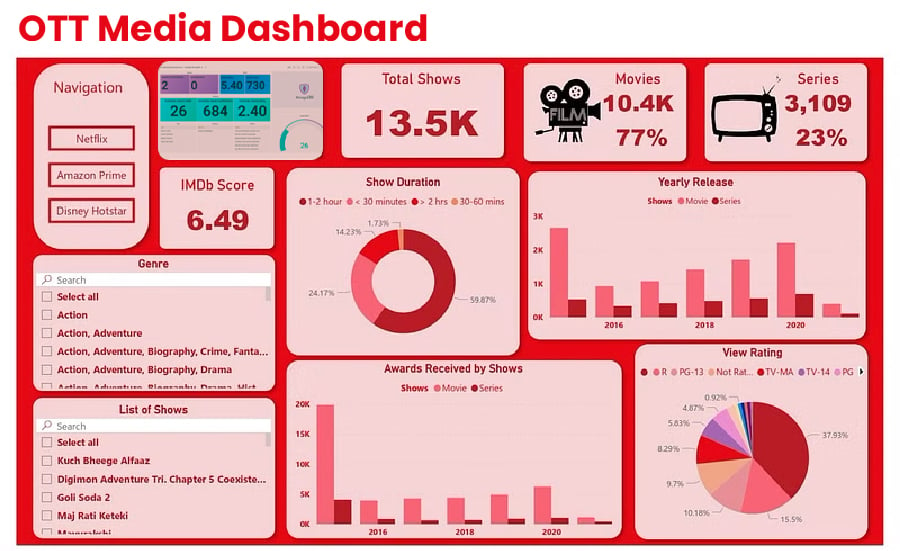
As you know that OTT applications and platforms like Netflix, amazon prime uses cookies for getting the data of users, so that they can personalize the recommendations and enhance the engagement. You can easily visualize this strategy using power BI projects in pie charts, bar graphs, line charts, and more.
The above list of dashboard examples of Power BI must be clear to you, all these dashboards are crucial to learn about power BI dashboard templates. All these dashboards are made for making your work easier for you. It can help you to manage your data turn into insightful data. Thus, you must use these power BI dashboard ideas for your academics also, and if you faces any issues in doing it, you can get our assistance in the following manner.
Also Read: How to Share Power BI Report?
Excel Your Power BI Assignment with Us!
The above description is enough to make you understand the dashboard's power BI examples. We have discussed 15 such dashboards that can simplify your tasks and manage your data effectively. You must read about each of them and manage your statistical data accordingly. However, if you face any issues with it, you must get our assistance for your academics. At Global Assignment Help, we have an adequate staff of experts proficient in power BI. Thus, it is best to get Javascript assignment help from us rather than struggling with it. We will help you become a professional data analyst, so click the button given below to visit us.
Free Tools

Paraphrasing Checker Tool
Easy to Use Paraphrasing Tool to Simplify Complex Academic Writing
Check Now
Dissertation Outline Generator
Get Structured Outline by Professionals for Your Dissertation
Check Now
Referencing Tool
Effortlessly manage citations and references with our smart referencing tool
Check NowLowest Price Guarantee
Get A+ Within Your Budget!Price Calculator
Offers & Benefits
Get upto 56% OFF on Your First Order !
Offers Benefits
Other Services
Latest Blogs

- 17 Apr 2025
- 4418 Views

- 20 Mar 2025
- 689 Views

- 04 Mar 2025
- 515 Views

- 28 Feb 2025
- 614 Views


Thank you for submitting your comment on this blog. It is under approval. We will carefully review your submission and post it on the website.